We use cookies to tailor the experience of creating resumes and cover letters. For these reasons, we may share your usage data with third parties. You can find more information about how we use cookies on our Cookies Policy. If you would like to set your cookies preferences, click the Settings button below. To accept all cookies, click Accept.
Settings Accept
Cookie settings
Click on the types of cookies below to learn more about them and customize your experience on our Site. You may freely give, refuse or withdraw your consent. Keep in mind that disabling cookies may affect your experience on the Site. For more information, please visit our Cookies Policy and Privacy Policy.
Choose type of cookies to accept
Analytics
These cookies allow us to analyze our performance to offer you a better experience of creating resumes and cover letters. Analytics related cookies used on our Site are not used by Us for the purpose of identifying who you are or to send you targeted advertising. For example, we may use cookies/tracking technologies for analytics related purposes to determine the number of visitors to our Site, identify how visitors move around the Site and, in particular, which pages they visit. This allows us to improve our Site and our services.
Performance and Personalization
These cookies give you access to a customized experience of our products. Personalization cookies are also used to deliver content, including ads, relevant to your interests on our Site and third-party sites based on how you interact with our advertisements or content as well as track the content you access (including video viewing). We may also collect password information from you when you log in, as well as computer and/or connection information. During some visits, we may use software tools to measure and collect session information, including page response times, download errors, time spent on certain pages and page interaction information.
Advertising
These cookies are placed by third-party companies to deliver targeted content based on relevant topics that are of interest to you. And allow you to better interact with social media platforms such as Facebook.
Necessary
These cookies are essential for the Site's performance and for you to be able to use its features. For example, essential cookies include: cookies dropped to provide the service, maintain your account, provide builder access, payment pages, create IDs for your documents and store your consents.
Here are 200+ sales statistics to take your sales figures to the next level.
The stats are drawn from studies, surveys, and articles from trusted sources like The Harvard Business Review, The Pew Research Center, HubSpot, Gallup, Baylor University, and Salesforce.
If we couldn’t find the original source, we didn’t use it.
The data boils down to one thing: Do you enjoy selling?
If you don’t and you have to sell, can you find a way to enjoy it?
The answer feeds into what the sales statistics are saying. As Dale Carnegie said, if you can find a way to help others, you will both enjoy selling and succeed.
This monster list of sales statistics is:
Organized by category for easy use (see our table of contents below).
Drawn from trusted sources like the Harvard Business Review and Nielsen Research.
Stuffed with sales stats from all the most popular categories.
Kept up to date (always) by our on-the-clock research team.
Need a sales statistic fast? Use this handy table of contents to jump to mini-lists within the article.
Here are the top sales statistics from our full list of 200+.
The sales stats below are the cream of the crop—the best and most popular skimmed from our entire article.
They’re eye-popping, motivational, and they’ll have you selling like Joe Girard in no time flat.
Posts with videos can generate engagement rates of 50% or more. (Databox)
80% of sales are made by 20% of salespeople. The winners sell to the prospects the losers give up on. (Bill Corbin on LinkedIn)
92% of sales pros give up after the 4th call, but 80% of prospects say no four times before they say yes. (MarketingDonut)
46% of salespeople didn’t intend to go into sales. (Hubspot)
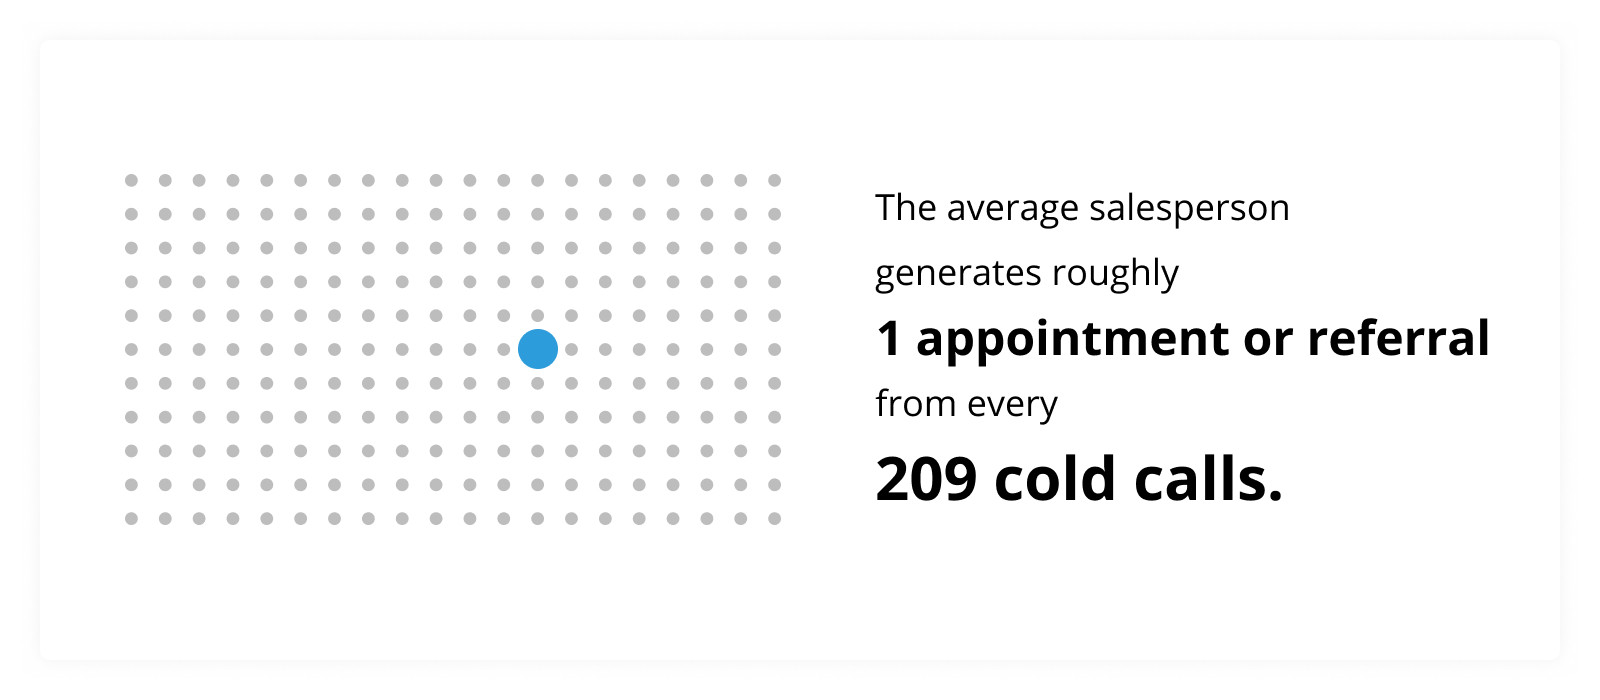
The average salesperson generates roughly one appointment or referral from every 209 cold calls. (Baylor University)
What do buyers want from sales pros? 69% say, “Listen to my needs.” (Hubspot)
Optimistic sales pros outperform pessimists by 57%. That’s even true when pessimists have better selling skill sets. (Forbes, Seligman)
By 2021, customers will handle 85% of all business contact without ever interacting with a human. (Gartner Customer 360)
The average sales conversion rate across all industries is 2.46%–3.26% (Statista)
You can get anything you want if you help enough other people get what they want. (Zig Ziglar)
2
Social Selling Statistics
Headed for the social selling launchpad? You’re not alone. Social selling is fast becoming the most popular sales channel.
What is social selling? It’s when sales pros interact directly with prospects through social media.
Most Americans (68%+) use YouTube and Facebook. Plus, 84% of buyers who use social media have larger buying budgets than non-social buyers.
The vast majority of Americans use YouTube (73%), Facebook (68%), or some other social media (22%–35%) as of 2018. (Pew Research Center)
Want to sell? 72% of salespeople who use social media in their sales process outperform their peers. (Down from 78.6% in 2012) (Jim Keenan Study)
Want to hit your quota faster? Social sellers hit their quotas 66% more often than those who don’t use social media. (Sales Benchmark Index)
54% of salespeople can track closed deals back to social media engagement (Jim Keenan Study)
Afraid social media will suck up all your time? 50.1% of salespeople who use social media spend less than 10% of their time on it.
Video is king. Posts with videos can generate engagement rates of 50% or more. (Databox)
96% of consumers want more contact with industry leaders. They often seek it through Twitter. (Databox)
Buyers who use social media typically have 84% bigger budgets than non-social-users. (Social Buying Meets Social Selling)
74.9% of companies that use social selling grow their sales teams in the next 12 months. (The State of Social Selling)
90% of top-performing sellers use social media in their sales strategy. (State of Sales)
More than 70% of sales pros use social selling tools like Facebook, Twitter, and LinkedIn. (State of Sales, LinkedIn)
50% of sales pros spend 3–10 hours per week using social selling tools. (State of Sales, LinkedIn)
84% of C-Level execs and 75% of B2B buyers use social media to make purchasing decisions. (Social Buying Meets Social Selling)
The average B2B buyer who relies on social media to make buying decisions is senior, has a big budget, makes frequent purchases, and has more power to make buying decisions. (Social Buying Meets Social Selling)
3
Sales Follow-Up Statistics
We know persistence pays, but in what way?
The data show most sales pros give up too soon. The sales statistics below on following up show 20% of all sales reps make 80% of the sales. They sell to the prospects abandoned by the rest.
Don’t give up. 50% of all sales happen after the 5th contact, but most reps give up after just 2. (InsideSales)
It takes 8 cold calls to reach a prospect. 72% of all sales calls aren’t answered. (Baylor University)
92% of sales pros give up after the 4th call, but 80% of prospects say no four times before they say yes. (MarketingDonut)
80% of sales are made by 20% of salespeople. The winners sell to the prospects the losers give up on. (Bill Corbin on LinkedIn)
Increasing customer retention by 5% boosts profits by 25%–90% (Harvard Business Review)
Acquiring a new customer costs 5–25 times more than keeping an existing customer. (Harvard Business Review)
Only 2% of sales happen at the first meeting. (MarketingDonut)
Stay vigilant. 83% of prospects who request info don’t buy for 3–12 months. (MarketingDonut)
70% of salespeople stop at one email. Yet if you send more emails, you’ve got a 25% chance to hear back. (YesWare)
The best time to contact a lead? 4–6pm on a Thursday, or 5 minutes after their inquiry. (LeadResponseManagement)
4
HubSpot Statistics
HubSpot is a popular inbound marketing and sales software solution. It helps companies get leads, then turn them into customers.
HubSpot analyzed data from its 41,000+ customers, and compiled a great list of sales statistics. See the highlights below.
85% of marketing teams say supporting their sales team is their #1 priority. Still, 56% of salespeople must prepare their own sales materials. (Hubspot)
46% of salespeople didn’t intend to go into sales. That makes 4.14 million accidental sales pros in the U.S. (Hubspot)
Salespeople spend 66% of their day on administrative tasks. (Hubspot)
The vast majority of sales pros use networking events, company trainings, and conferences to sharpen their sales skills. (Hubspot)
The biggest chunk of sales pros (25%) have a business degree. The next biggest slice (17%) didn’t go to college. (Hubspot)
Only 19% of customers trust salespeople. (Hubspot)
19% of buyers want to talk to a sales rep when first learning about a product. (Hubspot)
Sales pros who try to reach leads in one hour are 7x more likely to have meaningful conversations. (Hubspot)
Only 7% of salespeople respond within five minutes of a form submission (Hubspot)
On average, people delete 48% of their emails in five minutes. (Hubspot)
5
Cold Calling Statistics
Cold calling is hard. The sales statistics for cold calling below show it takes 209 cold calls to generate a single appointment. The majority of all cold calls don’t go through in the first place.
The takeaway from these cold-calling outbound sales statistics? The average sales rep using cold calling can make one appointment per day.
The average inside sales rep can make 33 cold calls per day. (ForEntrepreneurs and The Bridge Group)
Typical inside sales reps have 6.6 conversations per day. (ForEntrepreneurs and The Bridge Group)
More conversations per day correlates directly with higher quota attainment. (ForEntrepreneurs and The Bridge Group)
90% of CEOs say they never return cold calls or cold emails. (InsideView)
The average salesperson generates roughly one appointment or referral from every 209 cold calls. (Baylor University)
About 72% of all cold calls don’t get through to a human being. (Baylor University)
The average sales pro will spend 7.5 hours cold-calling to secure one appointment or referral. (Baylor University)
1 in 59 calls actually answered generates an appointment or referral. (Baylor University)
The most effective time to cold-call is from 10am–2pm. Least effective? After 5pm. (Baylor University)
91% of cold emails are opened the day after they’re sent. (YesWare)
6
Sales Success Statistics
Want to succeed in sales? Listen to customers, learn their needs, and find a way to fix their problems.
Free up time to do that by using the right tools.
The sales success statistics below suggest genuine interest in your buyers’ challenges is a sure path to revenue growth.
Tools for success. 75%–85% of top salespeople value CRMs, productivity apps, email marketing, and social selling as key factors in their success. (State of Sales, LinkedIn)
Asking questions about your buyer’s goals and pain points leads to better sales success. (Gong)
For better sales success, space your questions evenly throughout each sales call. (Gong)
Successful reps are 10x more likely to use collaborative words like “us,” “we,” and “our” and avoid words like, “I” and “me.” (Chorus)
The most successful sales pros use confidence-boosting lingo like “definitely,” “certainly,” and “absolutely” 5x more than low performers.
What do buyers want from sales pros? 69% say, “Listen to my needs.” 61% say, “Don’t be pushy” and “give me relevant information.” 51% want salespeople to respond in a timely manner. (Hubspot)
Prospects who are asked to take just a small step are twice as likely to spend. They spend just as much as those asked to spend a lot. (Cialdini)
Curiosity, intelligence, and an agile mind are the biggest predictors of sales success. (Harvard Business Review)
The most successful salespeople have aligned their personal goals with work goals. (Harvard Business Review)
Optimistic sales pros outperform pessimists by 57%. That’s even true when pessimists have better selling skill sets. (Forbes, Seligman)
7
Online Sales Statistics
Online sales is growing at Usain Bolt speeds. Amazon sells more than 600 items every second.
Most shoppers shop online, and never interact with a sales pro at all. Yet most would rather interact with a human. Why don’t they? The price.
By 2021, customers will handle 85% of all business contact without ever interacting with a human. (Gartner Customer 360)
Almost 82% of buyers viewed 5–8 pieces of content from a vendor before buying. (DemandGen Report)
79% of American shoppers shop online. They do it to find lower costs, not convenience. (PewResearch)
If price is equal, 64% of Americans would rather shop in person than online. (PewResearch)
82% of Americans check online reviews and ratings before buying. (PewResearch)
Only half of American shoppers trust online reviews and ratings. (PewResearch)
217 million American shoppers buy online. (Statista)
Mobile shoppers spend $3.2 trillion a year as of 2017. That’s almost doubled in the past five years. (ReadyCloud)
58% of shoppers in a survey of 5,849 will spend more to get free shipping. (EConsultancy)
80% of online shoppers trust Amazon reviews most. (CourseHero)
63% of shoppers look at a store’s return policy before they buy. (ComScore)
8
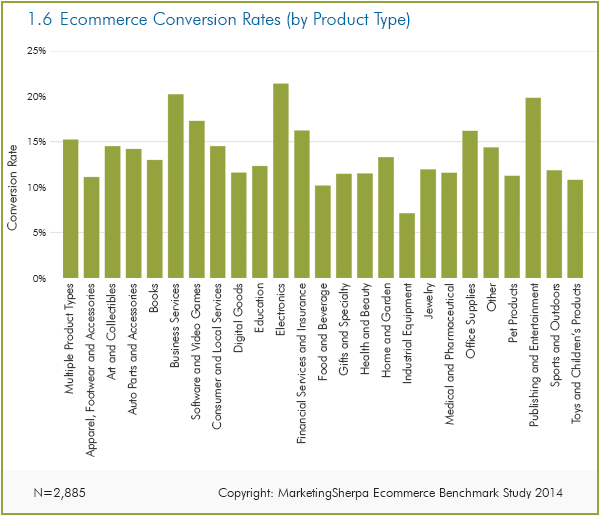
Sales Conversion Rate Statistics
How’s your conversion rate? Do you measure up? The average rate regardless of industry is about 3%.
The sales statistics below show sales conversion rate by industry. Some categories, like electronics, enjoy rates of over 20%.
The average sales conversion rate across all industries is 2.46%–3.26% (Statista)
Most e-commerce stores reach sales conversion rates of 5% or less. (MarketingSherpa)
Conversion rate for fashion and apparel stores: 6% (Fireclick Index)
But what’s a closer? By the sales statistics below, it’s an outside sales rep who closes 40%+ of the time, or an inside sales rep who does half that.
Want to see how you measure up? Take a stroll through the sales stats below.
Inside sales pros succeed with 18% of pitches. (IHireSalesPeople)
Outside sales pros see an average 40% closing rate. (IHireSalesPeople)
The average close rate for all industries is 19%. (HubSpot)
The average close rate for electronics sales pros is 22%. (HubSpot)
63% of all sales interactions end with the sales pro not asking for the sale. (Zig Ziglar)
96% of salespeople quit after four attempts, but 60% of sales happen after the 5th attempt. (Variation on a popular sales stat, originally by Zig Ziglar)
You can get anything you want if you help enough other people get what they want. (Zig Ziglar)
The phrase, “Show you how” lowers closing rates by 13% if it’s used more than four times in one sales call. (Gong)
“Discount” lowers close rates by 17%.
Go easy on your company name. If you use it 4+ times in one sales call, you’ll hurt close rates 14%.
10
Sales Training Statistics
Does sales training matter? Who does more of it, and do they see a healthy ROI?
According to the sales statistics below, it takes half a year to train the typical sales pro. That pro then sticks around for two more years before she flies the coop.
High performing sales teams pay close attention to training, and see 9% faster revenue growth as a result.
The average newly-hired salesperson has 2.6 years of prior experience. (ForEntrepreneurs and The Bridge Group)
The average new hire is fully productive in 5.3 months. 24% are ready in 1–3 months, and 16% take longer than 7 months. (ForEntrepreneurs and The Bridge Group)
How long does the average sales rep stick around? 2.5 years. 36% leave in less than 2 years, while 32% stay longer than 3 years. (ForEntrepreneurs and The Bridge Group)
The average sales pro sticks around for 2.2 years at full productivity. (ForEntrepreneurs and The Bridge Group)
Turnover for the average sales team is about 34%. 66% of that is involuntary. (ForEntrepreneurs and The Bridge Group)
The average sales pro’s base salary is $60K. The average On-Target Earnings is $118K. (ForEntrepreneurs and The Bridge Group)
67% of reps hit their quotas, down from 74% in 2012. (ForEntrepreneurs and The Bridge Group)
Train your people. 61% of execs admit their sales managers aren’t properly trained in pipeline management techniques. (Harvard Business Review)
Companies that train managers to manage their sales pipelines see 9% faster revenue growth. (Harvard Business Review)
64% of companies expect to spend less than $10,000 on training their sales team this year. (Hubspot)
Manage your team. Companies that spent 3+ hours per month managing their sales reps’ pipelines saw 11% higher revenue. (Harvard Business Review)
More than half of all sales reps rely on their peers to hone their skills. 44% turn to managers. Only 35% depend on team trainings. (Hubspot)
¾ of all companies use classroom trainings as their main way of training sales staff. (Highspot)
High-performing companies are 2x as likely to provide their sales teams with ongoing training. (Highspot)
Sales pros with 3–4 years of experience spend more time than those with less or more experience. That’s probably because rookies don’t plan to stay in sales and veterans are satisfied with their skills. (Hubspot)
Sales pros with less product knowledge benefit the most when empowered by management. (Ahearne, Mathieu, & Rapp)
U.S. sales teams spend over $70 billion a year on training. It’s 80% forgotten in 3 months. (Harvard Business Review, Sales Performance International)
U.S. companies spend $1 billion a year on executive coaching. (Forbes)
For every $1 spent on business coaching, companies see a $7 return. (Forbes)
11
Salesforce Statistics
Salesforce is one of the most respected Customer Relationship Management(CRM) tools in the world. It has an estimated 3.75 million users. A user-base of that size generates a lot of data!
The facts below come from Salesforce’s observations about how their customers sell. The biggest takeaway here? Focus on helping people.
51% of top sales pros focus their efforts on relationship-building. (Salesforce)
Top-performing sales teams are 2.8x more likely to say their organizations have shifted toward personalizing customer interactions. (Salesforce)
79% of business buyers want their sales reps to be trusted advisors who add value. Customers want consultants, not old-style sales pros. (Salesforce)
83% of business buyers want salespeople focused on helping them achieve their company goals. (Salesforce)
73% of sales teams say it’s critical to collaborate across departments. (Salesforce)
Sales pros spend only 36% of their time on selling-related tasks. (Salesforce)
AI use by sales teams will more than double in the next three years. (Salesforce)
High-performing sales pros are more than twice as likely to use AI to guide their selling. (Salesforce)
89% of top performers say management has increased sales empowerment in the past five years. Only 45% of low performers say the same. (Salesforce)
In-person communication is still king. (Salesforce)
12
Door-to-Door Sales Statistics
Believe it or not, door-to-door sales still generates nearly $30 billion a year in sales!
Are you one of the lucky knuckle-pounding sales pros? The door-to-door sales statistics below will help put you in the frame.
Successful door-to-door reps canvass a neighborhood 3x and talk with 90% of the residents.
To be successful, a door-to-door sales pro needs a 30%–40% contact rate. (Spotio)
Door to door sales is still a $28.6 billion industry. (Safewise and BLS.gov)
A typical sales pro can knock on 20 doors per hour. (realestatecareermentor)
The average sales pro can create one lead for every 50 doors they knock on. (realestatecareermentor)
On average, a door-to-door sales pro can add one lead every two hours. (realestatecareermentor)
What’s the best time to knock on doors? All of them. Make your first pass in the evening, your second in the morning, and your third in the afternoon to catch 90% of all prospects in a neighborhood. (Spotio)
Door-to-door reps talk to 40%–50% of prospects in an area on a single pass. That generates 16–20 contacts for every 40 attempts. (leadheroes)
25% of all contacts will listen to a sales pro’s pitch. (leadheroes)
About 2% of all door-to-door knocks will generate a sale. (leadheroes)
Door hangers left by door-to-door knockers generate one call back for every 200 hangers left. (leadheroes)
13
Prospecting Statistics
There’s gold in them thar hills! Find out where before you dig. Nobody loves sales prospecting, but you can’t sell without it.
How many calls does it take to reach a buyer? How many new opportunities a month will keep you solvent? The prospecting sales statistics below can help you home in on the motherlode.
42% of sales pros say prospecting is the hardest part of their job. The rest say it’s closing (36%) or qualifying (22%) (Hubspot)
100-200 new sales opportunities per month is best. 72% of companies with 50 or less new opportunities per month didn’t meet their sales goals. That’s vs 15% with 50–100 opportunities, and just 4% with over 100. (Hubspot)
Don’t put it off. Average salespeople slack off the first two months of a quarter, then scramble in month three. Their third-month efforts get a lower success rate. (Gong)
Know your products. 58% of prospects want to know pricing on the first call. 54% want a product demo. (Hubspot)
Only 15% of prospects want to talk about purchase authority on the first call. Less than a quarter want to talk about their budget or timeline. (Hubspot)
60% of prospects want to talk to sales staff after they’ve researched options. (Hubspot)
On average, it takes 18 calls to reach a buyer. (TopoHQ)
90% of sales pros use 2+ contact info providers. (TopoHQ)
Video is key. 70% of prospects watch a video to help them decide. (So, send customized videos.) (ThinkWithGoogle)
Product feature videos are the most popular with prospects. Next come how-tos and reviews. (ThinkWithGoogle)
14
Fun Facts About Sales
Looking for some sales fun facts to give your next presentation a little sizzle? Take a look below. These sales statistics and facts make fantastic icebreakers.
Chick-fil-A has mastered customer loyalty so well it can afford to pay its store operators 2x–3x more than the industry average. (Bain)
48% of sales statistics have no basis in reality and don’t cite a reliable source for where they got their data (Santa Claus)
Are you neurotic and introverted? Take heart. Introverts and neurotic personalities do just as well in sales jobs as their extroverted, confident counterparts. (Furnham & Fudge)
More than 1 in 10 jobs in America are full time sales jobs. (Salesforce)
Top sales pros outperform low performers by 10:1 and average ones by 2:1. (Salesforce)
Companies spend $1 trillion a year on their sales forces. (Salesforce)
80% of all salespeople a customer interacts with are incompetent. (moveyourcompanyforward)
“Prospecting” is finding someone with the right problem. (workwisellc)
A team of 50 sales pros leaves 1,277 hours of voicemails every month. (hoopla)
Sales reps who can switch between introverted and extroverted modes outperform both introverts and extroverts by 24% to 32%. (Forbes, Psychological Science)
15
B2B Sales Statistics
Want to sell like Dan Englander with a pressing quota? Not sure which pain points to work on first?
The business sales statistics below will help you see the bigger picture. The main points? Have a formal sales process—and oh yeah—find a way to help your customers.
Your buyers are savvy. 74% of B2B buyers do half their research (or more!) online before they buy. (Forrester Research)
Get active on LinkedIn. More than half of all B2B buyers use LinkedIn to support purchase decisions. (Social Buying Meets Social Selling)
Make it personal. 84% of B2B buyers start their buying search with a referral. (Superoffice)
Get technical. By 2018, 20% of B2B sales teams will transition to virtual sales reps. (TechMarketingBlogSpot)
Your competition? Weak. 46% of customers strongly agree B2B businesses follow through on promises. (Gallup)
Your customers? Apathetic. 60% of B2B customers are indifferent. 29% are engaged. The rest? Actively disengaged. (Gallup)
20% of B2B customers have experienced a problem with a supplier. Only 40% of those feel the B2B resolved the problem. (Gallup)
Fight for engagement. B2B customers with high engagement scores get 50% more revenue and 34% higher profitability. (Gallup)
Go formal. B2Bs with formal sales processes generate 28% more revenue. (Harvard Business Review)
44% of execs think their organizations are ineffective at managing their sales pipelines. (Harvard Business Review)
16
Inside Sales Statistics
Outside sales is face-to-face. Inside sales happens over phone, email, and cloud-based applications.
Need an eye-catching inside sales fact? The inside sales statistics below can beef up your sales development playbook.
The average yearly quota for an inside sales pro is $985,000. (Harvard Business Review)
Inside sales teams pay 40%–90% less to acquire new customers. (Harvard Business Review)
Inside sales is growing 15x faster than outside sales. (SalesLoft)
75% of buyers would rather not meet face-to-face. (SalesLoft)
For every outside sales rep that gets hired, 10 inside sales reps get hired. (SalesLoft)
The average yearly quota for an outside sales rep is $2.7 million. Computer sales pros have the highest average quotas at $4.2 million. (Harvard Business Review)
Outside sales pros make 14% more than inside sales pros, on average. (SalesLoft)
A buyer receives 140 emails every day, opens about 20%, and clicks through to websites from just 2%. (radicati, mailchimp, tellwise) Yet targeting emails to a recipient's interests can achieve a 94% open rate. (superoffice)
93% of converted leads are reached by the 6th call attempt. (Velocify)
46% of fast-growing tech companies use inside sales, vs 21% outside sales. (Harvard Business Review)
Texting after you make a contact creates a 112%+ higher conversion rate. (Velocify)
17
Direct Sales Statistics
Direct sales is a $34 billion industry. 74% of U.S. consumers have bought something from a direct sales rep.
How many direct sales people are there? Do they make money? From Herbalife to Amway, find the direct sales statistics you’re looking for right here.
86% of buyers want to be able to ask in-person questions before buying, while 84% want to buy from someone they know and trust. (PewResearch)
70% of Americans want to be able to try out products in person. (PewResearch)
20 million people are involved in direct selling in the US. That figure has grown by 2%–50% each year since 2011. (Direct Selling Association)
74% of direct sales reps are female. 26% are male. (Direct Selling Association)
Direct selling is a $34.4 billion industry and has grown 1% to 6% each year since 2010. (Direct Selling Association)
Direct sales pros have higher incomes and higher education levels than the average American. (Direct Selling Association)
50%+ of buyers are likely to buy from a direct sales rep this year. (Direct Selling Association)
5+ million direct sales pros are building their own independent businesses. (Direct Selling Association)
800,000 direct sellers work full-time and 4.5 million work part-time. 15+ million sell to get discounts on products or services. (Direct Selling Association)
50% of customers feel “neutral” toward direct sales pros, while 31% approve of them. Only 20% of buyers dislike direct sales reps. (Direct Selling Association)
18
Referral Statistics
What’s more important in the sales world than referrals? They’re the most powerful form of advertising. Most buyers depend on them.
Did you know 84% of buyers start with a referral? And 92% of customers trust them? Find these and other referral sales statistics here.
84% of buyers start their buying process from a referral. (Harvard Business Review)
90% of all buying decisions rely on peer recommendations. (Harvard Business Review)
92% of buyers trust product/service referrals from those they know. (Nielsen)
83% of customers are glad to give a referral after a positive experience. Only 29% actually do, because salespeople don’t ask. (Texas Tech)
61% of buyers have recommended local businesses to an acquaintance. (BrightLocal)
Referrals are the most effective form of advertising, since 84% of consumers trust recommendations from people they already know. (Nielsen)
Word of mouth creates $6 trillion in consumer spending every year. (CMO)
People of all age groups trust peer recommendations more than any other source. (Deloitte)
Millennials are 3x likelier than baby boomers to seek advice from social channels before a purchase. (Kelton Research)
The top two sources of buyer advice are peers and industry experts. (DemandGen)
19
CRM Statistics
Technically, CRMs have been around since 1986. Lately though, they’ve taken off like an Elon Musk experiment.
Most sales reps and managers agree they spend too much time on housekeeping. CRMs slash admin time to a fraction of its former self.
57% of sales pros spend 3–10+ hours per week using CRM tools. (State of Sales, LinkedIn)
CRMs are the most popular sales tools, followed by social prospecting, data services, email, phone, and sales cadence. (SalesforLife)
91% of businesses with 11+ employees use CRM software. (Buyerzone)
A properly integrated CRM can provide a 245% ROI. (Forrester)
50% of teams using a well-integrated CRM see improved productivity. (Forrester)
For every dollar spent on CRM, the average company sees an $8.71 return. (Nucleus Research)
40% of sales pros still use spreadsheets instead of CRMs. 22% don’t know what a CRM is. (HubSpot)
CRMs can boost sales by 29% and productivity to 34%. (Salesforce)
74% of sales pros say CRMs give them better access to customer data. (Software Advice)
24% more sales pros meet their annual quotas when they have mobile access to their CRM. (Aberdeen Group)
Key Takeaway
There’s your 200+ sales statistics to help put your job into perspective.
It helps to know how you measure up to the competition. Sales stats like the ones in this article can help.
As a sales pro, it helps to know how the top performers spend their time. (For example, most top sales pros use CRMs and social media. They’re persistent and they build relationships.)
Knowing what the bottom performers do can save you from a costly mistake. For instance, poor sellers don’t take advantage of training, use AI, or work to engage their customers.
Did we miss a favorite sales statistic? Want to call us out on a sales stat you think is iffy? Let us know in the comments!
Tom Gerencer is a career expert and Certified Professional Resume Writer who has published over 200 in-depth articles on Zety. Since 2016, he has been sharing advice on all things recruitment from writing winning resumes and cover letters to getting a promotion.
You need to write a cover letter, but what is a cover letter, exactly? And what’s the best way to write it? Learn how to write a cover letter the best way with tips from experts.
Some say the gig economy is booming, some say it’s declining. Learn the complex truth about the gig economy from statistics and research from 2023 aggregated from multiple independent sources.
![200+ Sales Statistics [Cold Calling, Follow-up, Closing Rates]](https://cdn-images.zety.com/pages/sales_stats.jpg?fit=crop&h=650&q=75)


![Gig Economy: Definition, Statistics & Trends [2023 Update]](https://cdn-images.zety.com/pages/gig_economy_statistics_2.jpg?fit=crop&h=250&dpr=2)