We use cookies to tailor the experience of creating resumes and cover letters. For these reasons, we may share your usage data with third parties. You can find more information about how we use cookies on our Cookies Policy. If you would like to set your cookies preferences, click the Settings button below. To accept all cookies, click Accept.
Settings Accept
Cookie settings
Click on the types of cookies below to learn more about them and customize your experience on our Site. You may freely give, refuse or withdraw your consent. Keep in mind that disabling cookies may affect your experience on the Site. For more information, please visit our Cookies Policy and Privacy Policy.
Choose type of cookies to accept
Analytics
These cookies allow us to analyze our performance to offer you a better experience of creating resumes and cover letters. Analytics related cookies used on our Site are not used by Us for the purpose of identifying who you are or to send you targeted advertising. For example, we may use cookies/tracking technologies for analytics related purposes to determine the number of visitors to our Site, identify how visitors move around the Site and, in particular, which pages they visit. This allows us to improve our Site and our services.
Performance and Personalization
These cookies give you access to a customized experience of our products. Personalization cookies are also used to deliver content, including ads, relevant to your interests on our Site and third-party sites based on how you interact with our advertisements or content as well as track the content you access (including video viewing). We may also collect password information from you when you log in, as well as computer and/or connection information. During some visits, we may use software tools to measure and collect session information, including page response times, download errors, time spent on certain pages and page interaction information.
Advertising
These cookies are placed by third-party companies to deliver targeted content based on relevant topics that are of interest to you. And allow you to better interact with social media platforms such as Facebook.
Necessary
These cookies are essential for the Site's performance and for you to be able to use its features. For example, essential cookies include: cookies dropped to provide the service, maintain your account, provide builder access, payment pages, create IDs for your documents and store your consents.
Some say the gig economy is booming, some say it’s declining. Learn the complex truth about the gig economy from statistics and research from 2023 aggregated from multiple independent sources.
With the total nonfarm payroll employment falling by 20.5 million in April, as well as the unemployment rate rising to close to 15% percent, many Americans will be forced to take on new means of making a living.
In a post-pandemic world, many job seekers will look towards the gig economy for answers.
That’s why we dug into some of the most compelling research on the gig economy to show you the magnitude of this phenomenon, the shape it’s in, as well as current and future trends.
What Is the Gig Economy?
Gig Economy Definition
Gig economy statistics show a free market system where organizations and independent workers engage in short-term work arrangements. BLS data suggest that in 2017 the US gig economy had 55 million participants. It's estimated that 36% of US workers take part in the gig economy and 33% of companies extensively use gig workers.
The word “gig” refers to the transient nature of the job itself.
The gig economy is not a new phenomenon—freelancers have been around for a while. So have consultants, temps, and so on. The reason why the gig economy has been under scrutiny for the past couple of years is that technology has lowered barriers to entry so much that “gigs” have become easily accessible to an unprecedented number of people.
What was perceived as a side hustle only a couple of years ago, turned into a trillion-dollar industry with millions of participants.
Because of the very technology that made all this possible, it became increasingly hard to clearly classify what counts as part of the gig economy and what doesn't.
What’s more, studies vary so much in terms of their design that many arrive at conflicting conclusions. Just like in the case of the Contingent Worker Supplement from the BLS and the study conducted by Alan Krueger of Princeton University and Larry Katz of Harvard University—with the latter saying that the gig economy is rapidly growing and the former that it's slowly shrinking.
So—
Let’s get in sync on the definitions first.
Say gig economy and people will think of:
Uber/Lyft drivers
TaskRabbit workers
Airbnb landlords
Online marketplace sellers
Volunteers
Artists
But the list should also include:
On-call workers
Multiple job holders
Contingent and part-time workers
Highly skilled contractors
Seasonal workers
Consultants
And many others
Gig economy participants sometimes treat their gigs as their main source of income, and sometimes as a secondary one. Some of them are highly skilled and this mode of work is their choice, some are unskilled and have no alternatives.
The statistics we present below come from multiple independent studies and cover all aspects of the gig economy to show what it looks like from several points of view.
Since the sheer variety of gig economy participants is huge, each study falls back on different terminology to refer to them:
MBO Partners distinguishes several types of so-called independents.
A full-time independent denotes a person working over 15 hours a week who chose this particular mode of work and doesn’t plan on altering it in the foreseeable future.
Part-time independent refers to those who regularly work less than 15 hours a week and treat their gigs as a way to supplement their usually insufficient monthly income.
Occasional independents encompassess those who do independent work sporadically, but at least once a month.
None of these terms, however, indicates the type of work performed by the person. So, a full-time independent could refer to a freelance management consultant just as much as to an Uber driver, independent artist, or a home-grown carpenter who sells their work via Etsy.
McKinsey report, for example, uses different nomenclature and the term primary independent earner refers to someone who earns their primary living from independent work.
As a general remark, the terminology used in studies indicates where the bulk of a person’s income comes from rather than what kind of job the person does.
20 Essential Gig Economy Statistics
The stats aggregated below illustrate the overall size of the gig economy:
57.3 million people freelance in the U.S. It’s estimated that by 2027 there will be 86.5 million freelancers. (Upwork)
36% of U.S. workers participate in the gig economy through either their primary or secondary jobs. (Gallup)
For 44% of gig workers, their work in the gig economy is their primary source of income. (Edison Research)
For 53% of gig workers aged 18-34, their work in the gig economy is their primary source of income. (Edison Research)
Gig employees are more likely to be young, with 38% of 18-34-year-olds being part of the gig economy. (Edison Research)
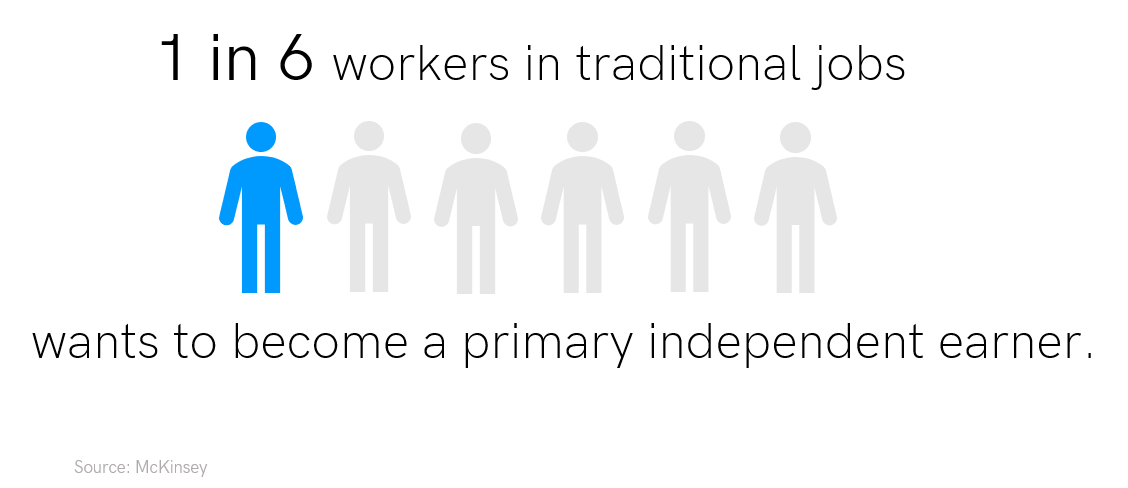
1 in 6 workers in traditional jobs would like to become a primary independent earner. (McKinsey)
Overall, it’s estimated that the independent workforce is larger than previously recognized: some 20 to 30 percent of the working-age population in the United States and the EU-15 countries are engaged in some form of independent earning today. (McKinsey)
Gig economy workers are projected to account for more than $1.4 trillion of the total US income in 2018. (PYMNTS)
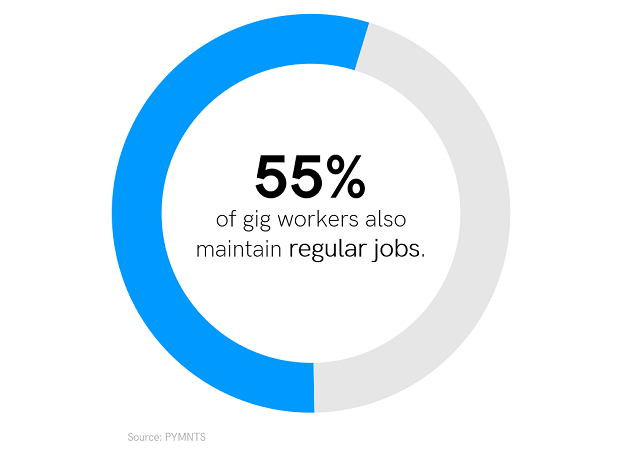
55% of gig workers also maintain full-time or regular jobs. (PYMNTS)
19% say the main reason they have a gig job is to make extra money or cover day-to-day expenses. (PYMNTS)
In 2017, the total share of the labor force working in nonstandard arrangements was 10.1%, down from 10.9% in 2005. (Economic Policy Institute)
The largest number of gig workers (14%) find gigs in arts, design, entertainment, sports, and media followed by sales and related (10%.) (PYMNTS)
An additional 3% to 10% of workers in mature economies and more than 30% in some developing countries reported using gig platforms as a secondary source of income. (BCG Henderson)
Deloitte’s latest millennial study found that 64% of full-time workers want to do “side hustles” to make extra money. (Deloitte)
In 2018, the number of occasional independents jumped 16.4% to 14.9 million from 12.9 million in 2017; their ranks have risen 42% from 10.5 million in 2016. (MBO Partners)
1 out of 5 full-time independents has customers outside the U.S. (MBO Partners)
The number of contingent employees will increase worldwide. In the US alone, contingent workers will exceed 40% of the workforce by 2020. (INTUIT)
Between 2013 and 2017, earnings fell by 53% in the transportation sector and grew by 69% in the leasing sector. (JPMorgan Chase)
Compared with workers overall, electronically mediated workers were more likely to be in the prime-working-age category (25 to 54) and less likely to be in the oldest age category (55 and over.) (BLS)
Gig Economy Statististics for Those Who Choose This Type of Work and Are Happy With It
As mentioned before, for some, gigs are voluntary, for others, not.
The numbers presented in this section focus entirely on those who chose this mode of life and don’t consider changing it anytime soon.
75.7% would not quit their gigs for a full-time job. (PYMNTS)
64% of gig workers say they are doing their preferred type of work. (Gallup)
60% of gig-dependent workers lack alternative employment because they don’t want or need one. (PYMNTS)
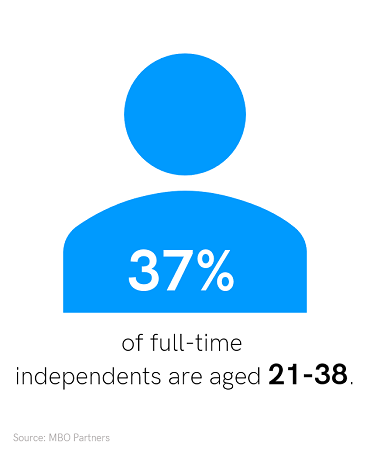
37% of full-time Independents are aged 21-38. (MBO Partners)
People who actively chose their working style reported greater satisfaction than those who felt forced by circumstance. (McKinsey)
41% of gig workers say they were hired because they have unique skills to complete an ad hoc project. (PYMNTS)
When asked to define their preferred future employment, around 45% chose remaining independent and adding clients as needed to increase their income, compared with only around 20% who preferred finding a full-time salaried position. (BCG Henderson)
63% of freelancers think that having a diversified portfolio of clients is more secure than one employer and have an average of 4.5 clients per month. (Upwork)
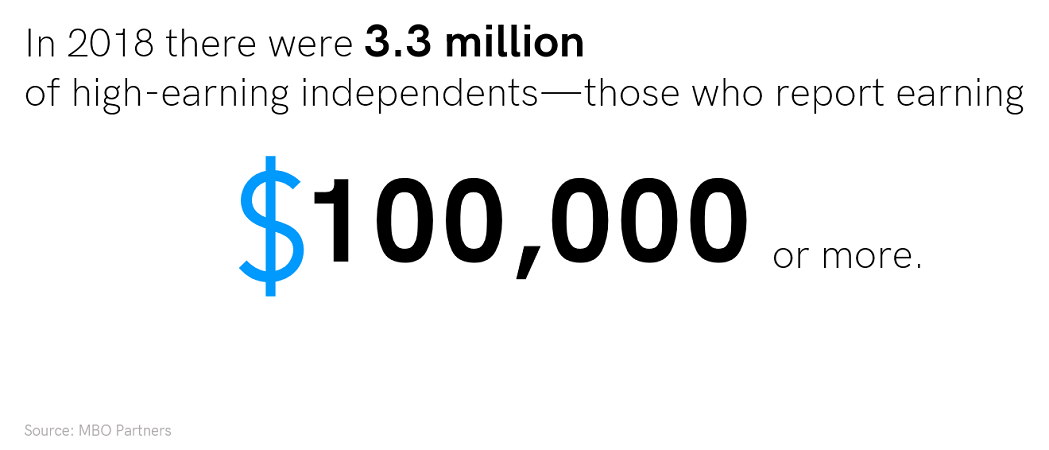
The number of high-earning independents—those who report earning $100,000 or more and likely work in highly skilled fields—keeps growing. In 2018 there were 3.3 million of them, which is about 21% of all full-time independents. (MBO Partners)
44% of full-time independents find work via word of mouth, with social media (12%) and online commerce marketplaces (like eBay, Etsy, or Airbnb) a distant second or third. (MBO Partners)
Only 4% of full-time independents identify online job platforms that match buyers and sellers of services as their top method of finding a job. (MBO Partners)
79% of full-time independents said they were happier working on their own than at a traditional job. (MBO Partners)
Gig Economy Statistics—Employers’ Perspective
The gig economy makes it easier for companies to access top talent. This is advantageous for both parties—
Companies economize on employee benefits and office overheads while cooperating with the human resources they need (and, most likely, lack in-house) on a specific project. On the other hand, freelancers can add another company to their portfolio thus building their credibility and brand.
The external workforce is critical for sourcing hard-to-find skills. Nearly three-quarters of executives cite the importance of gig workers in sourcing skills that are in scarce supply, with 91% saying this will be the case in three years’ time. (SAP Fieldglass)
62% of executives say external workforce enables them to improve the company’s overall financial performance. (SAP Fieldglass)
33% of organizations report extensively using alternative arrangements for IT, 25% for operations, 15% for marketing, and 15% for research and development. (Deloitte)
Gig workers are mainly employed by businesses (53%.) (PYMNTS)
Gig Economy Stats—Gig Workers by Necessity
The gig economy has many faces. For some, it’s not so much a choice as the only way to make ends meet.
Now—
Even though work arrangements within gig economy are notorious for not giving people the security some of them need, it’s thanks to the gig economy itself that they are able to make any money at all. Well, every cloud has a silver lining.
Out of those doing gig work as their primary source of income, 58% would have difficulty handling the unexpected expense of $400, compared to 44% of those doing gig work to supplement their income. (Report on the Economic Well-Being of U.S. Households in 2018)
80% of gig employees whose gig work is the primary source of income say that an unexpected expense of $1,000 would be difficult to pay. (Edison Research)
Full-time freelancers dip into savings more often (63% at least once per month versus 20% of full-time non-freelancers.) (Upwork)
45% of those who rely on gig work as their primary source of income have an Anxiety Index Score over 50, compared to only 24% of those employed but not in the gig economy. (Edison Research)
Gig Economy Stats for App-Based Drivers
One particularly prominent group of gig workers consists of app-based drivers—Uber and Lyft. Here’s a look at some statistics for this group:
The Uber driver W-2 equivalent hourly wage is roughly at the 10th percentile of all wage and salary workers’ wages, meaning Uber drivers earn less than what 90% of workers earn. (Economic Policy Institute)
The app companies have been able to expand their workforce by drawing principally immigrants without a four-year college degree who face restricted labor market opportunities. (New School and the University of California Berkeley Report)
60 to 65% of New York app drivers are full-time, without another job, and about 80% acquired a car to earn a living by driving. (New School and the University of California Berkeley Report)
Uber drivers earn the equivalent of $9.21 in hourly wages—less than what is earned by 90 percent of all other wage and salary earners, and below the minimum wage in 13 of the 20 major urban markets where Uber operates. (Economic Policy Institute)
About 16% of all drivers have no health insurance coverage. (New School and the University of California Berkeley Report)
For the Uber drivers working 50 hours a week or longer, real before-expense hourly earnings fell about 30% between 2014 and 2017. (New School and the University of California Berkeley Report)
This final stat is particularly interesting in the light of the ones that come before. Uber may have grown to be the largest ridesharing company in the world but its business model is easy to replicate and it has no real competitive advantage or unique assets.
In fact, surveys reveal that about 70% of drivers work for both Uber and Lyft. So, it seems like Uber’s business model is entirely dependent on large numbers of people who have no good reason to feel attached to the company—either because of the type of contract or competitive wages. No wonder there are voices saying that such an astronomical Uber’s IPO valuation makes no sense.
Gig Economy Stats—Impact of Technology
As we’ve already established, the gig economy isn’t a new phenomenon. The thing is, though, that thanks to the recent technological boom it has become accessible to a large number of people.
The stats below show the extent to which modern technology influenced this industry:
15% of independent workers have used a digital platform to earn and these platforms have grown rapidly in the past few years. (McKinsey)
Those who sell goods are most likely to use digital platforms—in this case, by listing on e-commerce marketplaces such as eBay and Etsy. (McKinsey)
Between 25 and 40% of those who earn independently by leasing assets use digital platforms such as HomeAway, Airbnb, or VRBO. (McKinsey)
Platforms for offering services, such as Uber, TaskRabbit, and Upwork, were used by only 6% of independent earners in the United States and the EU-15 (McKinsey)
69% of gig workers aged 18-24 use the Internet in their job hunts, but only 42% of those aged 64+ do the same. (PYMNTS)
Freelancers are finding more work online—71% say the amount of work they obtained online increased this year (up 5 points since 2016). (Upwork)
Online Platform Economy has continued to grow. Between 2013 and 2018, transportation platforms have grown to dominate in terms of both the number of participants and total transaction volume. (JPMorgan Chase)
Most participants in the Online Platform Economy are active in just a few months out of the year. (JPMorgan Chase)
Among those who generated earnings through transportation platforms at any point in a year, 58% had earnings in just three or fewer months of that year. In the other sectors (non-transport industry, selling, and leasing), engagement was even more sporadic, with less than 20% of participants generating earnings in more than half the year. (JPMorgan Chase)
Online platform earnings represent a major source of income (54%) for families during the months when they participate. However, platforms are not replacing traditional sources of family income. Among those who have participated in the Online Platform Economy at any point in a year, average platform earnings represent roughly 20% of total observed take-home income in any month of that year. (JPMorgan Chase)
Workers whose main job was in the transportation and utilities industry were more likely to do in-person work, and those in professional and business services and in information were more likely to do online work. (BLS)
The Online Platform Economy is growing but there’s no evidence that it is replacing traditional sources of income for most families. Even if platform work could in principle represent the “future of work,” most participants are not putting it to the type of use that would usher in that future. (JPMorgan Chase)
Gig Economy Statistics—Developing Economies
Undeniably, the spreading of the gig economy is a worldwide phenomenon and the number of participants is significant in almost any country in the world.
Although the stats below focus entirely on the Indian market, they reflect a larger trend characteristic of the other developing economies.
As many as 72% of all gig projects were in large corporates and professional service firms in 2018-19 compared with 52% two years back. (The Economic Times India)
Delhi added 560,600 people to its gig economy in the six months to 31 March, an 88% jump from 298,000 people in first half of FY19. The gig economy, led by food delivery firms Swiggy and Zomato, and ride hailing firms Uber and Ola, thrives largely unregulated, even as drivers and delivery boys work with little job security and few benefits. (Livemint)
70% of employer's used gig workers at least once or twice for solving organisational issues in 2018. (The Economic Times India)
2019 report by NobleHouse, a platform that connects businesses with skilled human resources talent, found that 73% of its respondents wanted to opt for freelance work over a conventional full-time job. (QZ)
A 2017 EY study on the “Future of Jobs in India” found that 24% of the world’s gig workers come from India. (QZ)
India is home to the second largest market of freelance professionals (about 15 million) who constitute about 40% of total freelance jobs offered worldwide. (ICRIER Future of Work in the Digital Era: Potential and Challenges for Online Freelancing and Microwork in India)
An analysis of online occupations in India measured by the online labour index projects reveals that software development and technology have the highest share, followed by the creative and media sector. (EY)
Key Takeaway
With more and more participants, the gig economy has significantly changed the contemporary business landscape—to the point where new legislation had to be introduced to regulate it.
Even though it’s notoriously hard to measure, it draws more and more people, becomes increasingly accessible worldwide, and creates new opportunities for employers to attract and cooperate with top talent on crucial projects that call for highly specialized skill sets.
For many gig economy participants, the gigs they do allow them to supplement their monthly income. However, there are some who make their primary living out of the gigs—this group consists of highly skilled professionals who cooperate with various businesses. Finally, the gig economy also comprises people who have families to support and no other option to make a living.
Maciej is a career expert and Certified Professional Resume Writer with a solid background in the education management industry. He's worked with people at all stages of their career paths: from interns to directors to C-suite members, he now helps you find your dream job.
Don't miss out on exclusive stories that will supercharge your career!
Get a weekly dose of inspiration delivered to your inbox
Great to have you on board! Check your email & enjoy our newsletter.
About 58% job seekers report their job search lasted 2 months or less. About 13% of candidates spend 7 months or more (even years) looking for a job. For employers, positions open for a few months should signal that the recruiting process might be faulty.
Interview coming up, and you just don’t know what to expect? Here’s a compilation of the most common interview questions that you might hear and how to answer them.
![Gig Economy: Definition, Statistics & Trends [2023 Update]](https://cdn-images.zety.com/pages/gig_economy_statistics_1.jpg?fit=crop&h=650&q=75)