We use cookies to tailor the experience of creating resumes and cover letters. For these reasons, we may share your usage data with third parties. You can find more information about how we use cookies on our Cookies Policy. If you would like to set your cookies preferences, click the Settings button below. To accept all cookies, click Accept.
Settings Accept
Cookie settings
Click on the types of cookies below to learn more about them and customize your experience on our Site. You may freely give, refuse or withdraw your consent. Keep in mind that disabling cookies may affect your experience on the Site. For more information, please visit our Cookies Policy and Privacy Policy.
Choose type of cookies to accept
Analytics
These cookies allow us to analyze our performance to offer you a better experience of creating resumes and cover letters. Analytics related cookies used on our Site are not used by Us for the purpose of identifying who you are or to send you targeted advertising. For example, we may use cookies/tracking technologies for analytics related purposes to determine the number of visitors to our Site, identify how visitors move around the Site and, in particular, which pages they visit. This allows us to improve our Site and our services.
Performance and Personalization
These cookies give you access to a customized experience of our products. Personalization cookies are also used to deliver content, including ads, relevant to your interests on our Site and third-party sites based on how you interact with our advertisements or content as well as track the content you access (including video viewing). We may also collect password information from you when you log in, as well as computer and/or connection information. During some visits, we may use software tools to measure and collect session information, including page response times, download errors, time spent on certain pages and page interaction information.
Advertising
These cookies are placed by third-party companies to deliver targeted content based on relevant topics that are of interest to you. And allow you to better interact with social media platforms such as Facebook.
Necessary
These cookies are essential for the Site's performance and for you to be able to use its features. For example, essential cookies include: cookies dropped to provide the service, maintain your account, provide builder access, payment pages, create IDs for your documents and store your consents.
What is the average number of applicants per job? How much does it cost to hire someone? How long does the recruitment process take? Number-crunching the job search is tricky business.
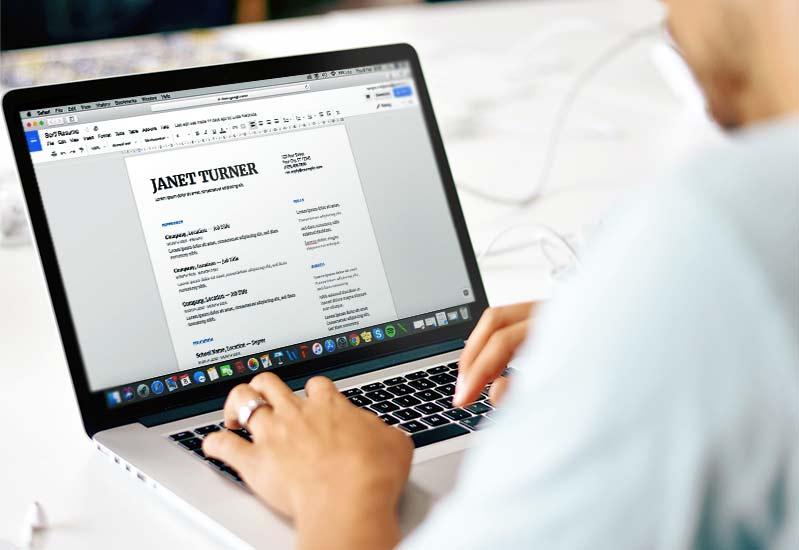
Wouldn't it be helpful if there was a collection of recruiting and job statistics all in one place? But who has time to research all the human resource and hiring statistics anyway... We do! Whether you’re a recruiter or a jobseeker, we've put together the best human resources stats out there to help you visualize the job search.
We’ll show you:
The ultimate collection of up-to-date hiring and recruitment statistics and facts.
96% of job seekers say that it's important to work for a company that embraces transparency. (Glassdoor U.S. Site Survey, 2017)
79% of job seekers say they are likely to use social media in their job search and this increases to 86% for younger job seekers. (The Open University, 2019)
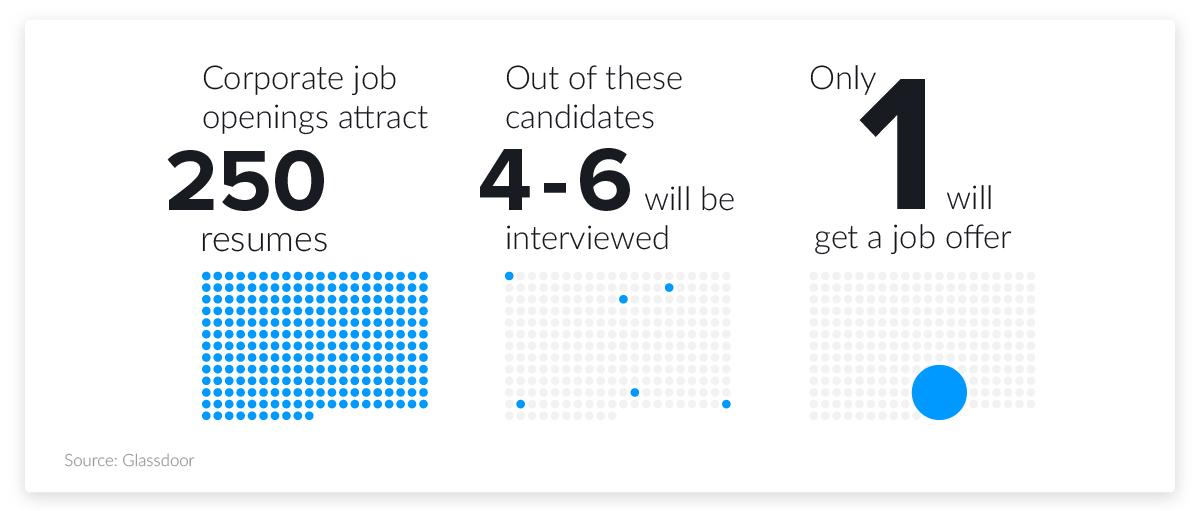
On average, each corporate job offer attracts 250 resumes. Of those candidates, 4 to 6 will get called for an interview, and only one will get the job. (Glassdoor)
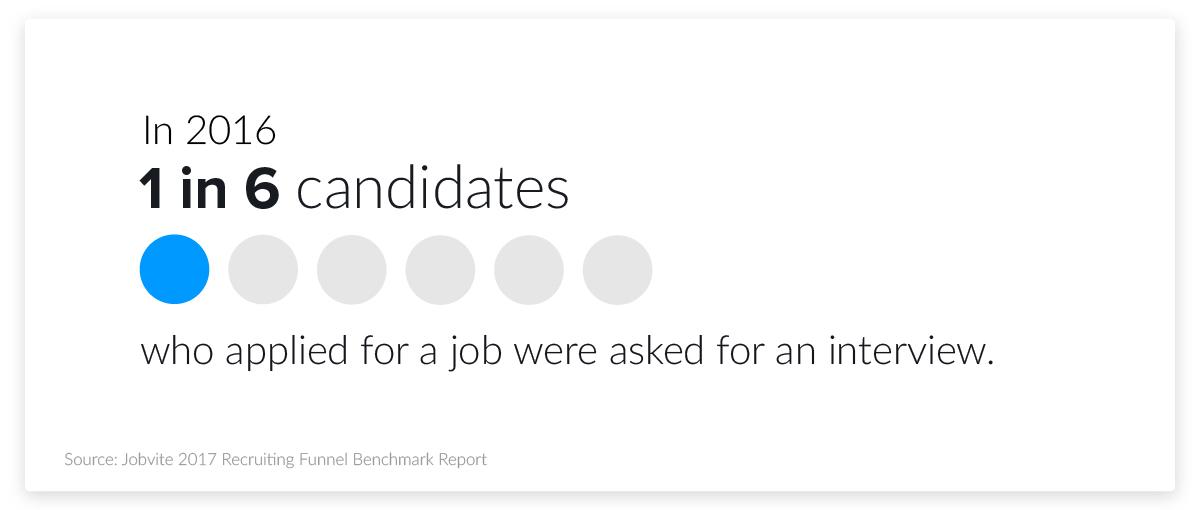
1 in 6 candidates who applied for a job were asked for an interview. (Jobvite 2017 Recruiting Funnel Benchmark Report)
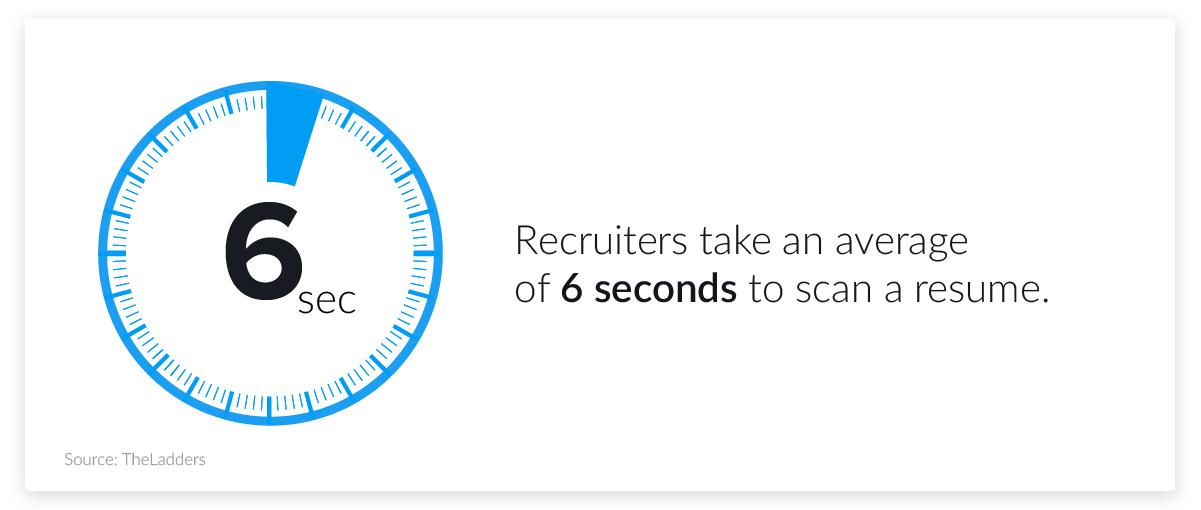
Recruiters take an average of 6 seconds to scan a resume. (TheLadders)
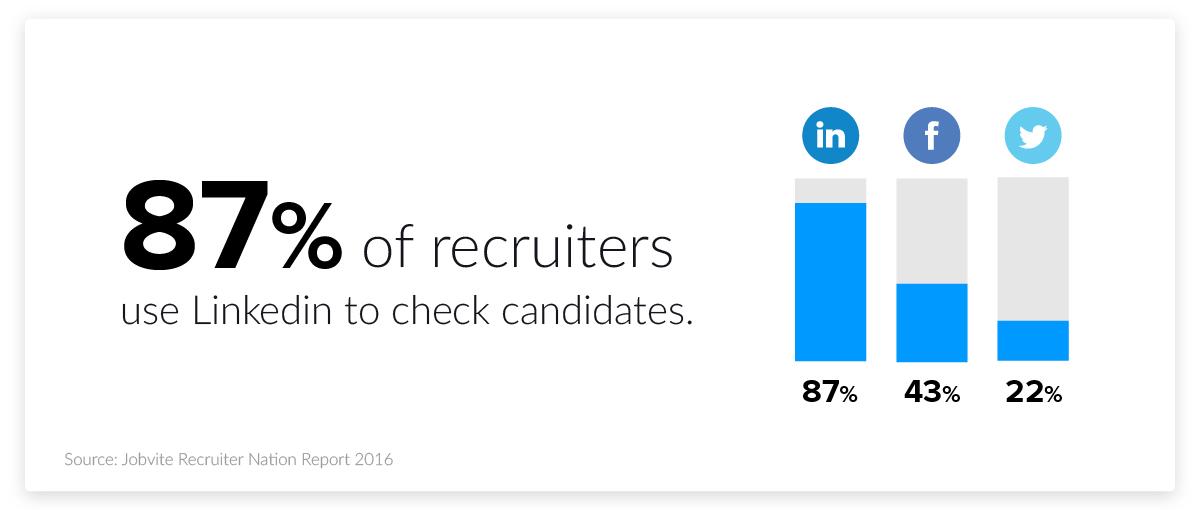
87% of recruiters use LinkedIn to check candidates. (Jobvite Recruiter Nation Report 2016)
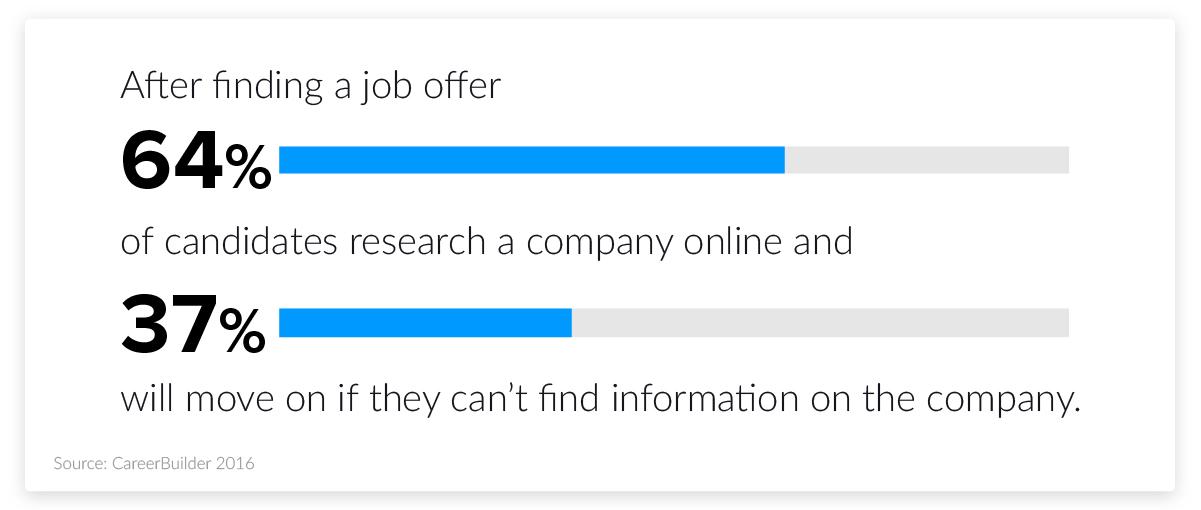
After finding a job opening, 64% of candidates said they research a company online and 37% said they will move on to another job opening if they can’t find information on the company. (Careerbuilder 2016)
Top 5 pieces of information job seekers want employers to provide as they research where to work:
○ Details on compensation packages
○ Details on benefits packages
○ Basic company information
○ Details on what makes the company an attractive place to work
○ Company mission, vision and values
(Glassdoor U.S. Site Survey, January 2016)
91% of employers prefer their candidates to have work experience, and 65% of them prefer their candidates to have relevant work experience. (NACE Job Outlook 2017)
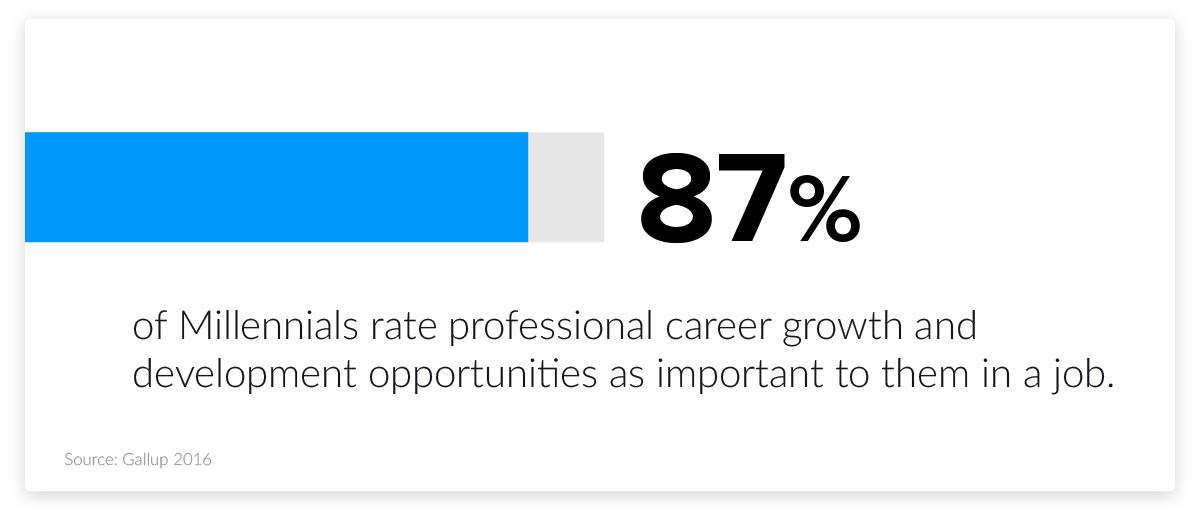
87% of Millennials rate professional career growth and developmental opportunities as important to them in a job. (Gallup 2016)
Nearly 80% of Millennials look for people and culture fit with employers, followed by career potential. (Collegefeed, March 2014)
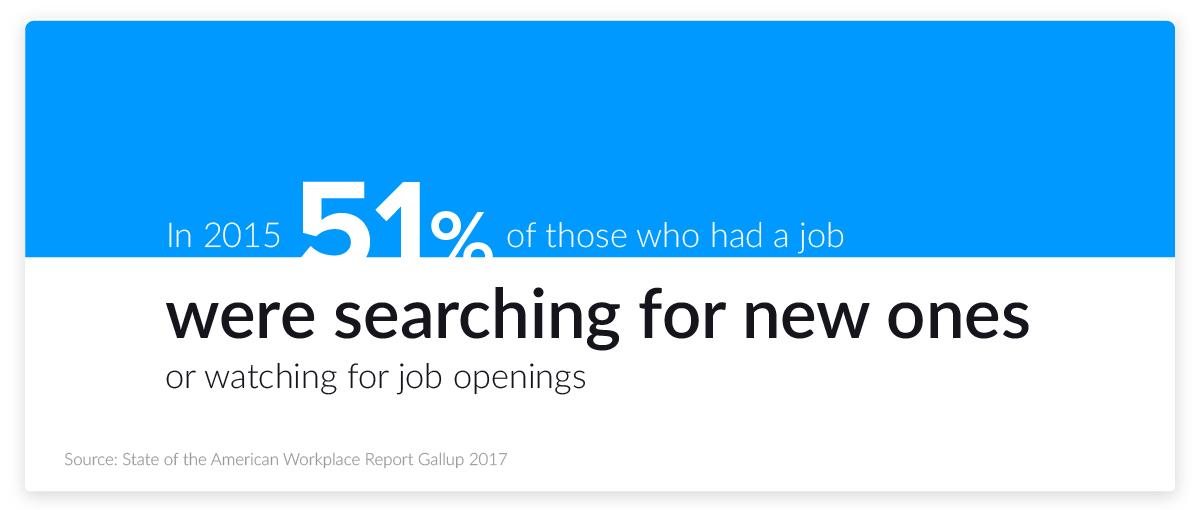
In 2015, 51% of those who did have jobs were searching for new ones or watching for openings. (State of the American Workplace Report Gallup 2017)
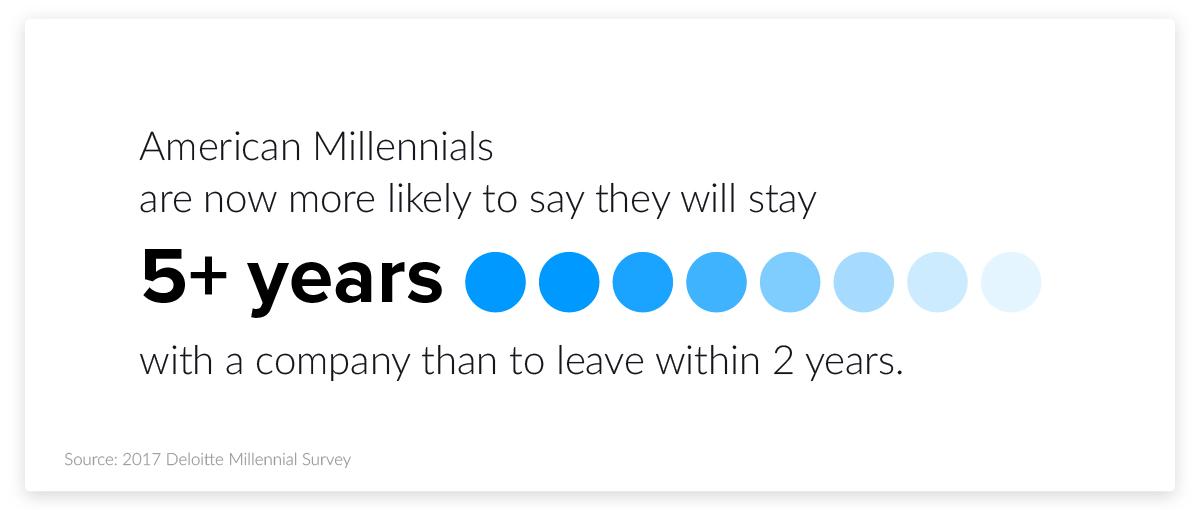
American Millennials are now more likely to say they will stay 5+ years with a company than to leave within 2 years. (2017 Deloitte Millennial Survey)
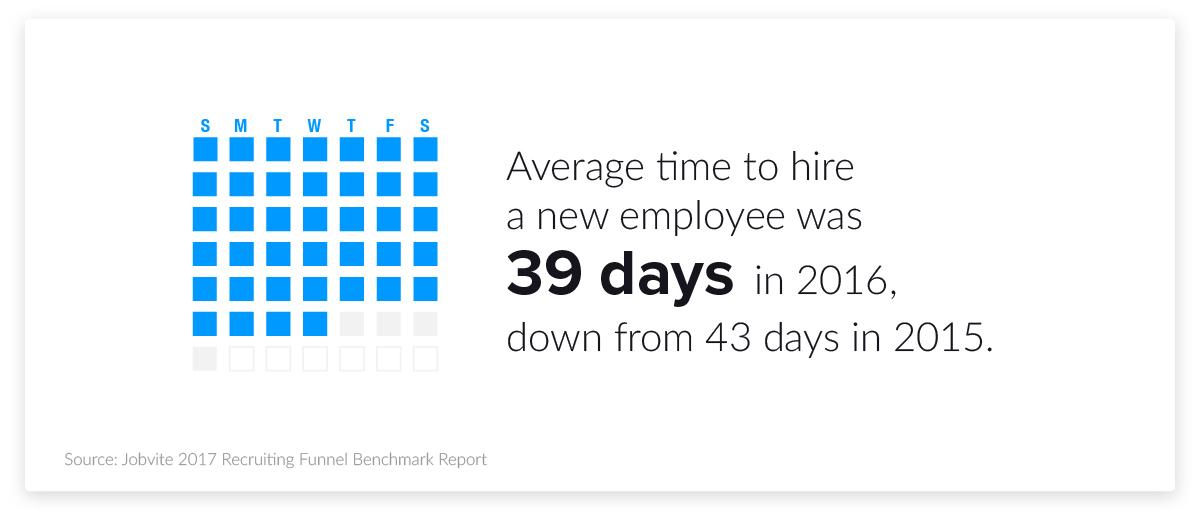
Average time-to-hire a new employee was 39 days in 2016, down from 43 days in 2015. (Jobvite 2017 Recruiting Funnel Benchmark Report)
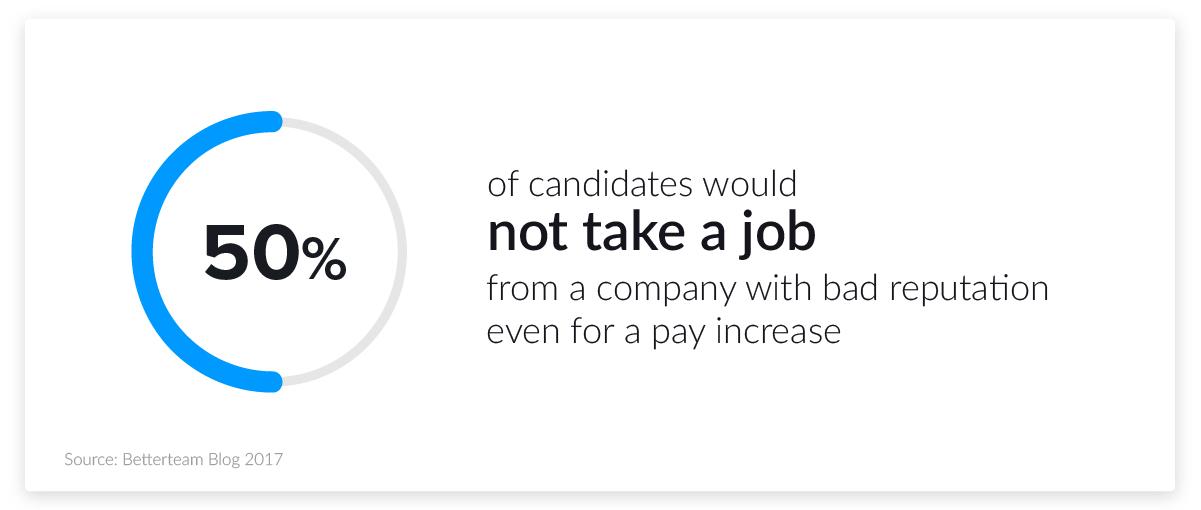
50% of candidates say they wouldn't work for a company with a bad reputation - even for a pay increase. (Betterteam Blog 2017)
92% would consider leaving their current jobs if offered another role with a company that had an excellent corporate reputation. (Corporate Responsibility Magazine, September 2015)
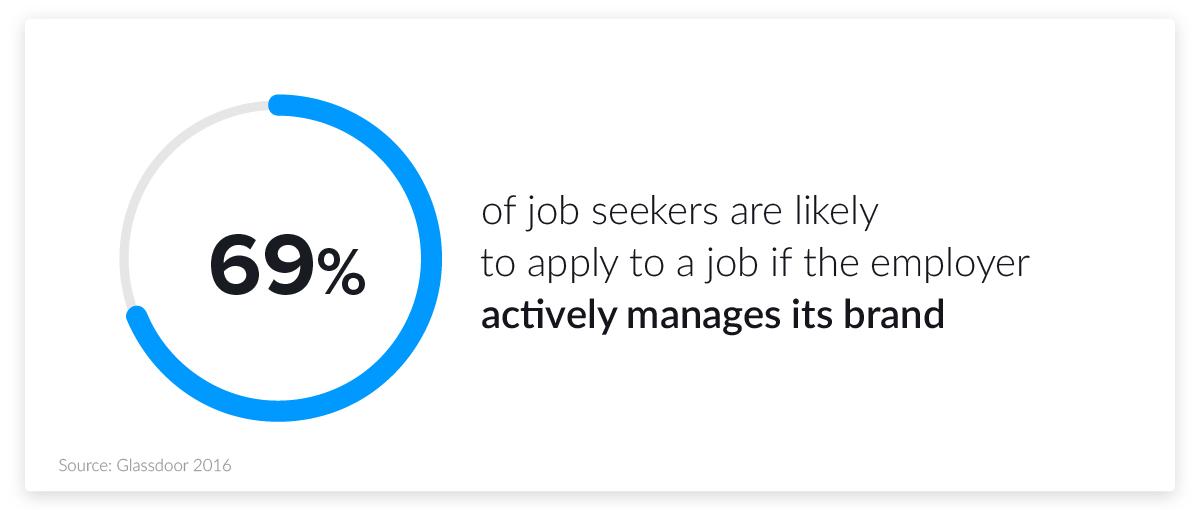
69% of job seekers are likely to apply to a job if the employer actively manages its brand. (Glassdoor 2016)
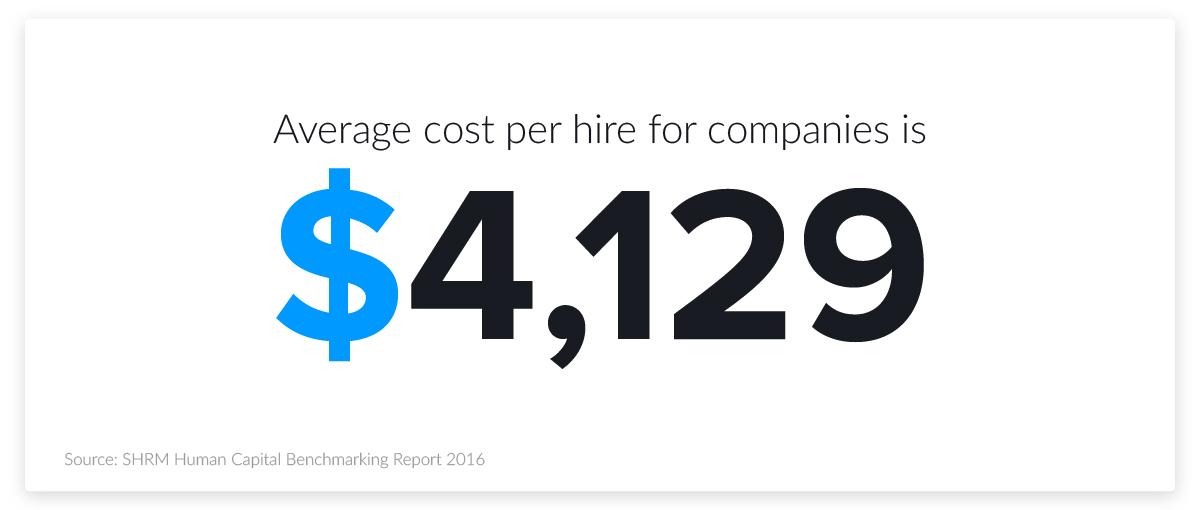
Average cost per hire statistics for companies is $4,129. (SHRM Human Capital Benchmarking Report 2016)
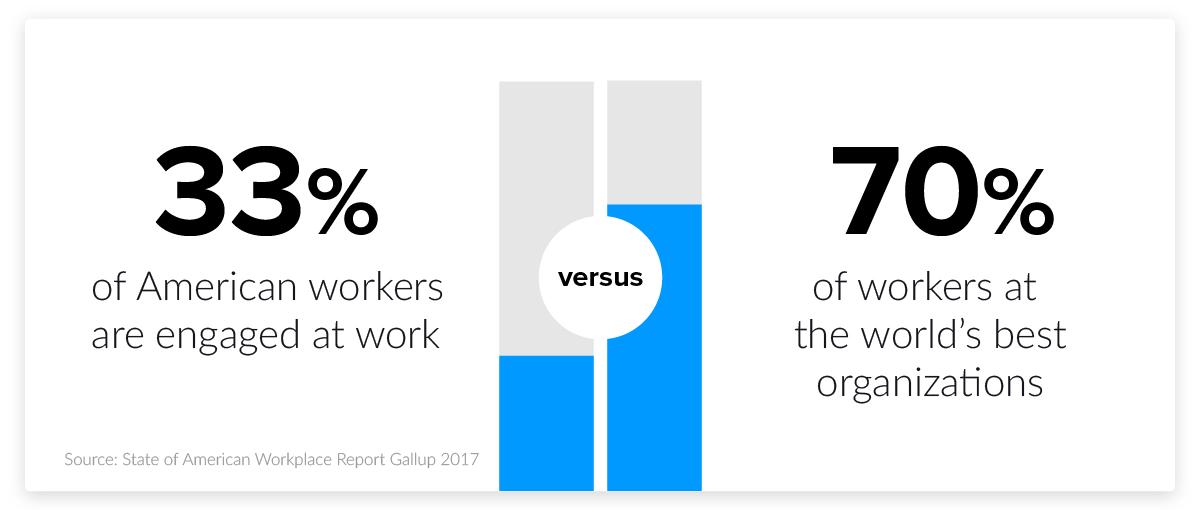
33% of American workers are engaged at work vs. 70% of workers at the world's best organizations. (State of the American Workplace Report Gallup 2017)
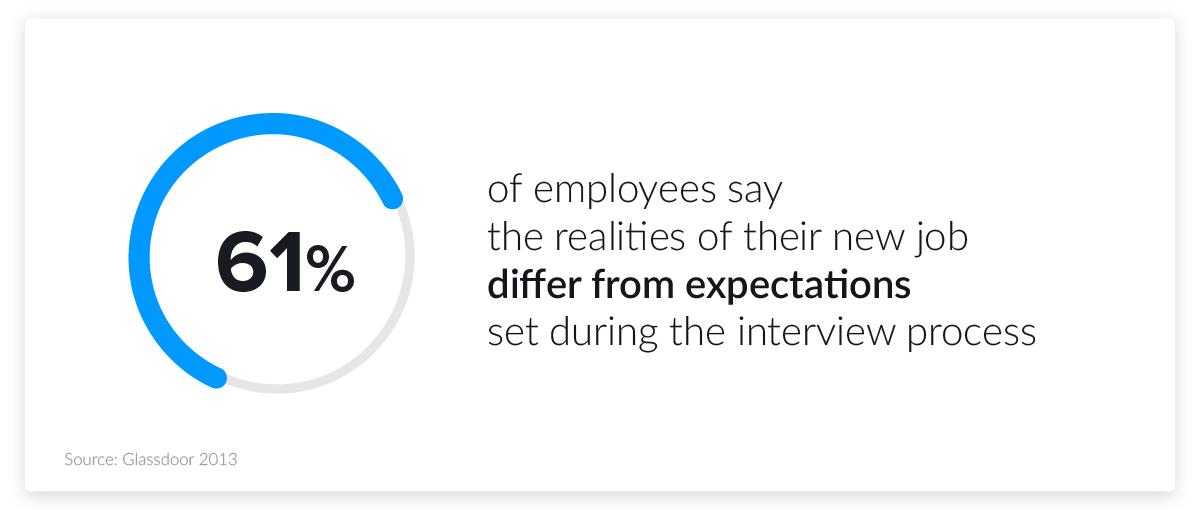
61% of employees say the realities of their new job differ from expectations set during the interview process. (Glassdoor 2013)
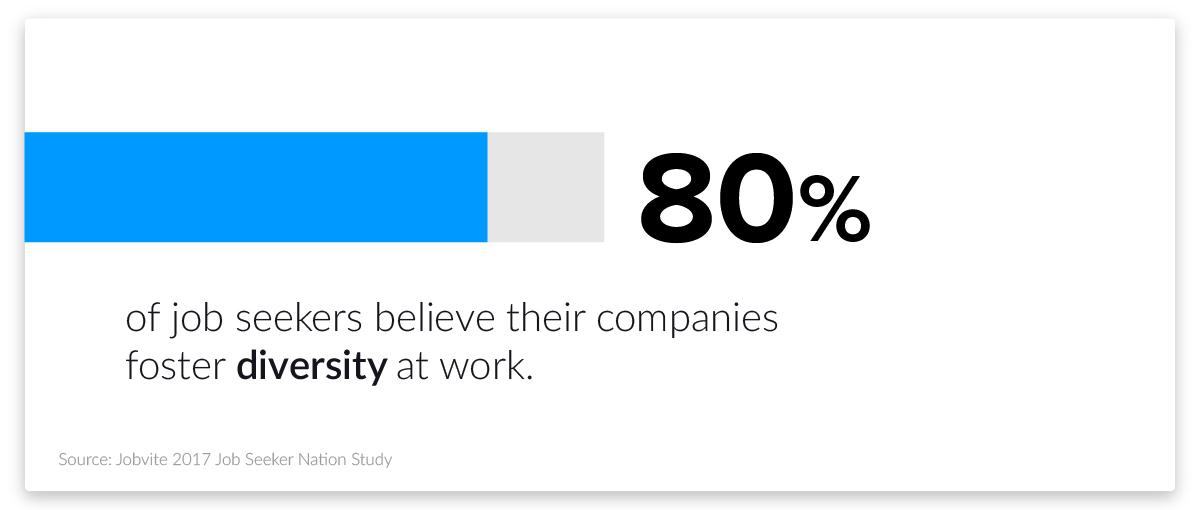
80% of job seekers believe their companies foster diversity at work. (Jobvite 2017 Job Seeker Nation Study)
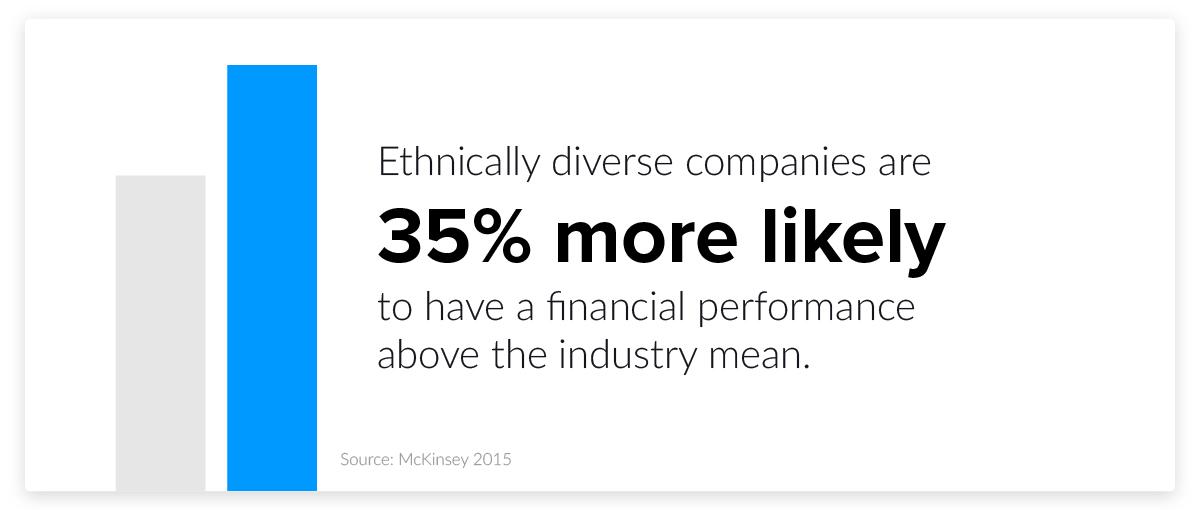
Ethnically diverse companies are 35% more likely to have a financial performance above the industry mean. (McKinsey 2015)
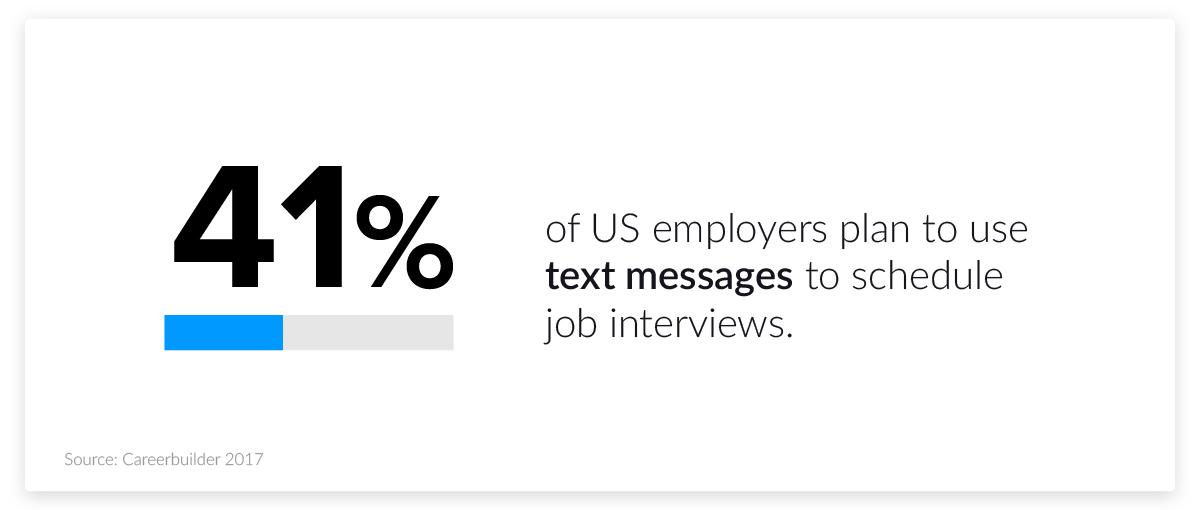
41% of US employers plan to use text messages to schedule job interviews. (Careerbuilder 2017)
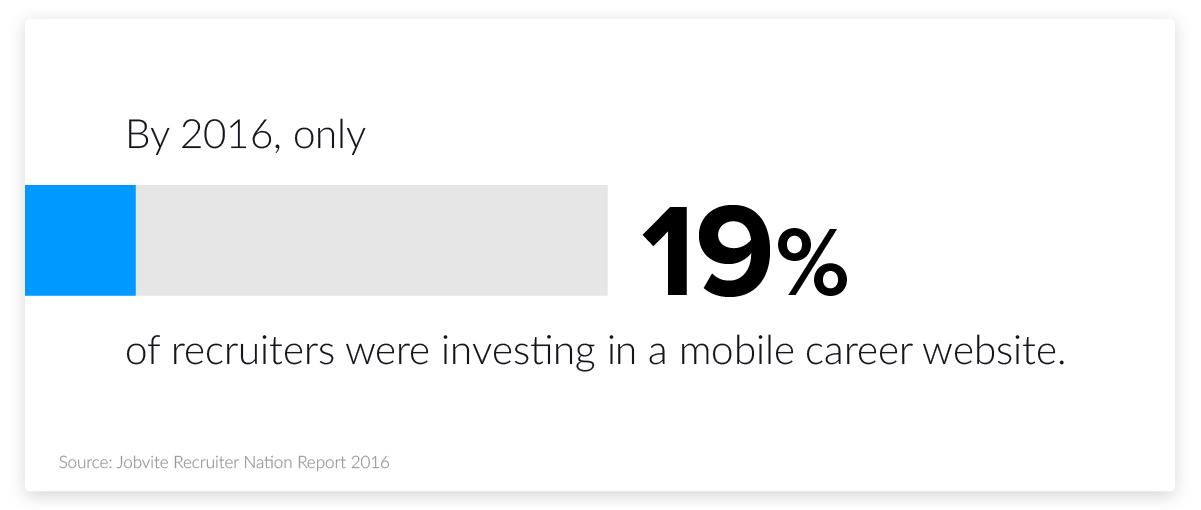
By 2016, only 19% of recruiters were investing in a mobile career website. (Jobvite Recruiter Nation Report 2016)
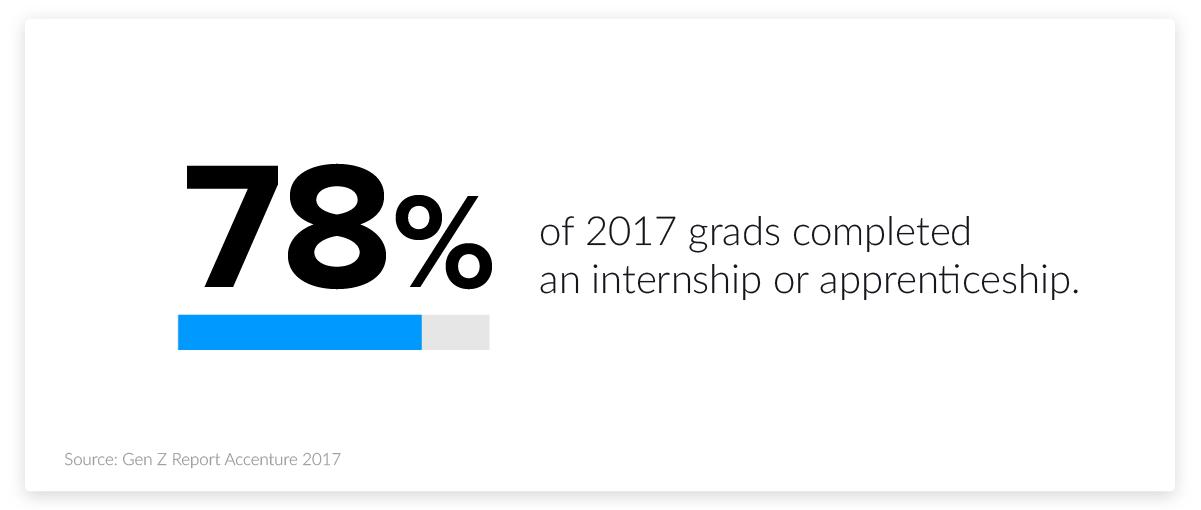
78% of 2017 grads completed an internship or apprenticeship. (Gen Z Report Accenture 2017)
97% of 2017 grads said they will need on-the-job training to further their careers. (Gen Z Report Accenture 2017)
In 2020 it's estimated that 35% of job openings required at least a bachelor’s degree, 30% of job openings required some college or an associate’s degree and 36% of job openings required no education beyond high school.
(Georgetown University Center on Education and the Workforce 2020)
The average number of jobs held in a lifetime is 12.5 for men and 12.1 for women.
(Bureau of Labor Statistics)
The number one reason why employees quit is a lack of appreciation at their current job. 79% of employees who quit claimed this was a major reason for leaving.
(O.C. Tanner 2019)
81% of employees would consider leaving their jobs for the right offer.
(Hays)
Up to 85% of jobs are filled via networking.
(LinkedIn)
2
Job Search Statistics
Current unemployment rate in the U.S. is 6.7% with 10.7 million people looking for jobs. (US Bureau of Labor Statistics, November 2020)
Long-term unemployed in the U.S. (longer than 6 months) make up 36.9% of the unemployed at 3.9 million. (Bureau of Labor Statistics, November 2020)
The average amount of time to find a job is 24weeks.
(Bureau of Labor Statistics, November 2020)
It takes 100–200 job applications to get one joboffer
(TalentWorks, 2017)
As of the last day of October 2020, there 6.7 million job openings available in the U.S.
(Bureau of Labor Statistics, December 2020)
The average length of a workweek was 38.7 hours in 2015, up from 38.1 hours in 1980. (The State of American Jobs Report Pew Research October 2016)
On average, a full-time employee in the United States of America works 1,786 hours per year.
(OECD, 2019)
Average number of weeks worked per year increased from 43 in 1980 to 46.8 in 2015. (Combined, it adds up to an additional month of work per year.) (The State of American Jobs Report Pew Research October 2016)
The average time at a job is 4.1 years. That's the median number of years that wage and salary employees have been with their current employer.
(Bureau of Labor Statistics, Employee Tenure in 2020, September 2020)
59% of employees say they've been working with their current employer for more than three years. And 22% of older millennials between 30 and 37 have been with their current employer for more than 7 years.
(Udemy)
In 2015, 51% of those who did have jobs were searching for new ones or watching for openings. (State of the American Workplace Report Gallup 2017)
89% of Glassdoor users are either actively looking for jobs or would consider better opportunities. (Glassdoor U.S. Site Survey, January 2016)
87% of organizations cite culture and engagement as one of their top challenges, and 50% call the problem "very important." (Global Human Capital Trends 2015, Deloitte, February 2015)
Current job satisfaction statistics for American workers:
○ Very Satisfied - 49%
○ Somewhat Satisfied - 30%
○ Dissatisfied - 9%
○ Very Dissatisfied - 6%
(The State of the American Jobs Report Pew Research October 2016)
In 2014, 51% of workers had worked for their current employer for 5+ years compared to 46% in 1996. (The State of American Jobs Report Pew Research October 2016)
Job seekers will spend an average of 11 hours a week looking for work. (Careerbuilder)
Only 12% of employees agree that their company does a good job of onboarding new employees. (State of the American Workplace Report Gallup 2017)
33% of American workers are engaged at work vs. 70% of workers at the world's best organizations. (State of the American Workplace Report Gallup 2017)
In 2015, Millennials became the dominant demographic on the labor market. (Pew Research 2015)
Millennials have the highest rates of unemployment and underemployment. (State of the American Workplace Report Gallup 2017)
Do workers think their credentials and qualifications match up with the requirements of their jobs?:
○ Overqualified - 41%
○ Qualified - 50%
○ Underqualified - 9%
(The State of American Jobs Report Pew Research October 2016)
68% of employees believe they are overqualified for their current job. (State of the American Workplace Gallup 2017)
44% of recent grads found it difficult or extremely difficult to find a job. (Gen Z Grads Class of 2017 Accenture)
49% of recent grads accepted a lower salary or compromised on benefits. (Gen Z Grads Class of 2017 Accenture)
Jobs requiring social skills have grown 83%. (The State of the American Job Report Pew Research October 2016)
Jobs requiring analytical skills (computer / critical thinking) grew 77%. (The State of the American Job Report Pew Research October 2016)
Jobs requiring both social and analytical skills have grown 94% since 1980. (The State of the American Job Report Pew Research October 2016)
○ Investment in Innovative Interviewing Tools - 34%
○ Company Mission Used as a Differentiator - 33%
○ Big Data - 29%
(LinkedIn Global Recruiting Trends 2017)
95% of recruiters say that hiring will remain as competitive in 2017 as it was in 2015 and 2016. (Jobvite Recruiter Nation Report 2016)
On average, each corporate job offer attracts 250 resumes. The typical employer will then interview 4–6 candidates for the job, and only one will be successful. (Glassdoor)
The average number of applicants per job opening was 29 in 2018, down from 36 in 2017 and 52 in 2016. (Jobvite 2019 Recruiting Benchmark Report)
63% of recruiters say talent shortage is their biggest problem. (2017 Recruiter Sentiment Study MRI Network)
Average time to hire a new employee was 39 days in 2016, down from 43 days in 2015. (Jobvite 2017 Recruiting Funnel Benchmark Report)
What barriers are there to identifying qualified talent?
According to recruiters:
○ Not enough suitable candidates - 63%
○ Candidates don't respond to calls and emails - 42%
○ Difficulty finding passive talent - 34%
○ Too many unqualified junk resumes from job boards - 23%
○ Other - 11%
(2017 Recruiter Sentiment Study MRI Network)
In 2016, 56% of recruiters said they can't make good hires because of lengthy hiring procedures. (2016 Recruiter & Employer Sentiment Survey MRI Network)
How many interviews before getting a job offer?
According to recruiters:
○ Three - 51%
○ Four - 22%
○ Two - 17%
○ Five or More - 9%
○ One - 1%
(2017 Recruiter Sentiment Study MRI Network)
The recruitment process can be longer depending on screening methods:
○ Phone Interview - +6.8 - 8.2 days
○ Group Panel Interview - +5.6 - 6.8 days
○ One-on-one Interview - +4.1 - 5.3 days
○ Background Check - +3.1 - 3.4 days
○ Presentation - +2.7 - 4.2 days
○ IQ Test - +2.6 - 4.4 days
○ Job Skills Test - +0.6 - 1.5 days
○ Personality Test - +0.9 - 1.3 days
○ Drug Test - +0.3 - 0.8 days
(Glassdoor)
Where do hires come from? Which source is used most for job searching and recruiting? Here are the top five sources:
○ Career Sites - 27.35%
○ Job Boards - 18.76%
○ Referrals - 15.83%
○ Internal Hire - 15.25%
○ Agency - 4.52%
(Jobvite 2017 Recruiting Funnel Benchmark Report)
Where are applications coming from? Here are the top five sources:
○ Job Boards - 52.17%
○ Career Sites - 33.90%
○ Referrals - 3.07%
○ Internal Hire - 2.26%
○ Agency - 1.76%
(Jobvite 2017 Recruiting Funnel Benchmark Report)
Internal hiring is 6x more effective than all other sources of hiring. (Jobvite 2017 Recruiting Funnel Benchmark Report)
Referrals are 5x more effective than all other sources of hiring. (Jobvite 2017 Recruiting Funnel Benchmark Report)
46% of employees hired through referral programs stay for three years or more, while only 14% of those hired through job boards stay. (Jobvite Index)
Referrals are hired 55% faster than those hired through a career site. (Jobvite Index)
To get quality referrals, 64% of recruiters report awarding monetary bonuses as incentive. (Jobvite Recruiter Nation Report 2016)
Average conversion rate of career websites visitors to applicants - 8.59% in 2016, down from 11% in 2015. (Jobvite 2017 Recruiting Funnel Benchmark Report)
In 2016, 1 in 6 candidates who applied for a job were asked for an interview. (Jobvite 2017 Recruiting Funnel Benchmark Report)
The average conversion rate from interview to offer - 19.78% in 2016 translating to 5 interviews per offer. (Jobvite 2017 Recruiting Funnel Benchmark Report)
The conversion rate of offers accepted - 83.1% in 2016, down from 89% in 2015. (Jobvite 2017 Recruiting Funnel Benchmark Report)
The average time from interview to job offer is 20–40 days, depending on your industry and location.
(Jobvite 2018 Recruiting Benchmark report and Glassdoor Time to Hire report 2017)
Why are job offers rejected?
According to recruiters:
○ Accepted Another Offer - 32%
○ Compensation - 25%
○ Took Counteroffer - 15%
○ Lengthy Hiring Process - 11%
○ Other - 6%
○ No Rejection - 5%
○ Limited Promotion or Career Pathing - 2%
○ No Flexible Scheduling - 2%
○ Inadequate or No Relocation Package - 2%
(2017 Recruiter Sentiment Study MRI Network)
According to candidates:
○ No Offer Was Rejected - 40%
○ Compensation - 27%
○ Accepted Another Offer - 12%
○ Limited Promotion or Career Pathing - 6%
○ No Flexible Scheduling - 6%
○ Other - 6%
○ Too Long Ago to Remember - 2%
○ Inadequate or No Relocation Package - 1%
○ Took Counteroffer - 0%
○ Lengthy Hiring Process - 0%
(2017 Recruiter Sentiment Study MRI Network)
How many interviews before a job offer was rejected?
According to recruiters:
○ Three - 45%
○ Two - 20%
○ Four - 17%
○ No Rejections - 10%
○ One - 4%
○ Five or More - 4%
(2017 Recruiter Sentiment Study MRI Network)
How much time passed between the first interview and a rejected offer?
According to recruiters:
○ 5-8 Weeks - 46%
○ 1-4 Weeks - 39%
○ No Rejections - 10%
○ 9+ Weeks - 5%
(2017 Recruiter Sentiment Study MRI Network)
Candidates don’t want to complete an application that will take longer than 20 minutes. (Careerbuilder)
76% of job seekers want to know how long it’s going to take to fill out an application before they start. (Careerbuilder)
66% of job seekers said they would wait only two weeks for a callback after which they consider the job a lost cause and move on to other opportunities. (Careerbuilder)
Average cost per hire for companies is $4,129. (SHRM Human Capital Benchmarking Report 2016)
The average cost of a bad hire is up to 30% of the earnings of the employee in the first year according to the Department of Labor. But a report from one CEO put the cost as high as $240,000.(US Department of Labor and Jörgen Sundberg, CEO of Link Humans)
What is most attractive to prospective hires? Company culture statistics.
According to recruiters:
○ Advancement Opportunities - 72%
○ Better Compensation Packages - 64%
○ Improved Work-life Balance - 58%
○ Better Company Culture - 37%
○ Fun Company Culture - 11%
○ Collaborative Environment - 10%
○ Access to Emerging Tech - 8%
○ Other - 7%
○ Training / Continued Education - 5%
○ Sense of Camaraderie - 2%
(2017 Recruiter Sentiment Study MRI Network)
According to candidates:
○ Competitive Compensation Packages - 52%
○ Emphasis on Work-life Balance - 38%
○ Advancement Opportunities - 31%
○ Collaborative Environment - 29%
○ Training / Continued Education - 27%
○ The Organization's Ethics - 27%
○ Work From Home Options - 25%
○ Ease of Commute - 21%
○ Fun Company Culture - 17%
○ Access to Emerging Tech - 16%
○ Sense of Camaraderie - 10%
○ Other - 3%
(2017 Recruiter Sentiment Study MRI Network)
Common benefits and perks that companies offer:
○ Paid Vacation - 92%
○ Health Insurance - 91%
○ Paid Leave - 86%
○ Other Insurance Coverage - 82%
○ Retirement Plan - 68%
○ Wellness Program - 58%
○ Reimbursement of Conference Fees - 57%
○ Professional Development Programs - 57%
○ Employee Assistance Programs - 56%
○ Company Perks (Discounts, Paid Memberships) - 55%
○ Free or Subsidized Parking or Transportation Passes - 50%
(State of the American Workplace Gallup 2017)
How important are work from home options for candidates?
○ Somewhat - 37%
○ Not Very - 28%
○ Not At All - 18%
○ Extremely - 18%
(2017 Recruiter Sentiment Study MRI Network)
Top five pieces of information job seekers want employers to provide as they research where to work:
○ Details on Compensation Packages
○ Details on Benefits Packages
○ Basic Company Information
○ Details on What Makes the Company Attractive
○ Company Mission, Vision, Values
(Glassdoor US Site Survey January 2016)
What job seekers expect to find on a job description:
○ Salary - 74%
○ Total Benefits Package - 61%
○ Employee Ratings - 46%
○ Contact Info of Hiring Manager - 40%
○ Work From Home Options - 39%
○ Description of Work / Life Balance - 35%
○ Photos / Videos of the Work Environment - 31%
○ Descriptions of Team Structures and Hierarchies - 27%
○ Number of People Who’ve Applied - 25%
(Careerbuilder)
90% of job seekers say that it's important to work for a company that embraces transparency. (Glassdoor U.S. Site Survey, January 2016)
76% want details on what makes the company an attractive place to work. (Glassdoor survey, October 2014)
61% of job seekers say they would leave their job for health insurance. (State of the American Workplace Gallup 2017)
92 percent would consider leaving their current jobs if offered another role with a company that had an excellent corporate reputation. (Corporate Responsibility Magazine, September 2015)
53% of employees who get paid vacation would leave for more at another company. (State of the American Workplace Gallup 2017)
50% of employees with retirement plans would leave for a better retirement plan. (State of the American Workplace Gallup 2017)
48% of employees who get paid leave would leave for more paid leave. (State of the American Workplace Gallup 2017)
35% of employees would change jobs for a flexible working location (off-site full time), only 12% of companies offer it. (State of the American Workplace Gallup 2017)
40% of employees would change jobs for profit sharing, 20% say companies offer it. (State of the American Workplace Gallup 2017)
51% of employees would change jobs for a retirement plan with a defined pension, 43% say companies offer it. (State of the American Workplace Gallup 2017)
51% of employees would change jobs for flextime, 44% say their company offers it. (State of the American Workplace Gallup 2017)
Real cost of employee turnover:
○ Entry-level Employees - between 30-50% of the annual salary to replace them.
○ Mid-level Employees - upwards of 150% of their annual salary to replace them.
○ High-level or Highly Specialized Employees - 400% of their annual salary.
Here’s what recruiters say will get a resume rejected in 2016:
○ Impersonal Applications (No Hiring Manager’s Name) - 84%
○ No Thank You Note After Interview - 57%
○ Resumes Aren’t Customized and Tailored - 54%
○ No Cover Letter - 45%
○ No Follow Up With Employer After Interview - 37%
(Careerbuilder)
What recruiters say they look for on a resume:
○ Job Experience - 67%
○ Cultural Fit - 60%
○ Cover Letters - 26%
○ Prestige of College - 21%
○ GPA - 19%
(Jobvite Recruiter Nation Report 2016)
On average, each corporate job offer attracts 250 resumes. Of those candidates, 4 to 6 will get called for an interview, and only one will get the job. (Glassdoor)
62% of employers are specifically looking for your soft skills. (Careerbuilder)
93% of employers consider soft skills an “essential” or “very important” factor in hiring decisions. (Wonderlic.)
42% of job seekers say that expanding their skill set is a top priority when choosing an employer.
○ Application Addressed to the Hiring Manager - 22%
○ Links to Personal Blogs, Portfolios, or Websites - 16%
(Careerbuilder)
Recruiters take an average of six seconds to scan a resume. (TheLadders)
Not using your professional skills can hurt a resume as much as one year of unemployment. The damage is limited for those who had temp agency employment. (American Sociological Review)
80.4% of resumes errors come from mistakes in former job experience descriptions. (TheLadders)
71.6% of resume errors come from the miscommunication of skills on a resume. (TheLadders)
68.7% of resume errors involved missing accomplishments. (TheLadders)
75% employers caught a lie on a resume. (CareerBuilder, 2018)
The typical job seeker writes only one resume in their job search. Typically, it's one page long. (Zety, 2020)
See Zety's complete study of 133,000 resumes for more: Resume Statistics
5
Job Interview Statistics
The average conversion rate from interview to offer was 19.78% in 2016, translating to 5 interviews per offer. (Jobvite 2017 Recruiting Funnel Benchmark Report)
The average interview process length in the US was 27.5 days in 2019. (CMD Recruitment)
In 2016, 1 in 6 candidates who applied for a job were asked for an interview. (Jobvite 2017 Recruiting Funnel Benchmark Report)
How many interviews come before a job offer?
According to recruiters:
○ Three - 51%
○ Four - 22%
○ Two - 17%
○ 5 or More - 9%
○ One - 1%
(2017 Recruiter Sentiment Study MRI Network)
Conducting a phone Interview can add 6.8 - 8.2 days to the recruitment process. (Glassdoor 2015)
Conducting a group panel interview can add 5.6 - 6.8 days to the recruitment process. (Glassdoor 2015)
Conducting a one-on-one interview can add 4.1 - 5.3 days to the recruitment process. (Glassdoor 2015)
How long does it take between an interview and a job offer?
According to recruiters the interview-to-offer timeline is most often three to six weeks:
○ 5-6 Weeks - 35%
○ 3-4 Weeks - 31%
○ 7-8 Weeks - 23%
○ 1-2 Weeks - 8%
○ 9+ Weeks - 3%
(2017 Recruiter Sentiment Study MRI Network)
How many interviews happen before a job offer is rejected?
According to recruiters:
○ Three - 45%
○ Two - 20%
○ Four - 17%
○ No Rejections - 10%
○ One - 4%
○ 5 or More - 4%
(2017 Recruiter Sentiment Study MRI Network)
How much time passed between the first interview and a rejected offer?
According to recruiters:
○ 5-8 Weeks - 46%
○ 1-4 Weeks - 39%
○ No Rejections - 10%
○ 9+ Weeks - 5%
(2017 Recruiter Sentiment Study MRI Network)
61% of employees say the realities of their new job differ from expectations set during the interview process. (Glassdoor 2013)
41% of employers say that they might not interview a candidate if they can’t find them online. (Careerbuilder)
A 10% harder interview process is associated with 2.6% higher employee satisfaction later. (Glassdoor 2015)
34% of recruiters list investment in innovative interviewing tools as a top trend for the near future. (LinkedIn Global Recruiting Trends 2017)
The most popular interview technique is structured interviews, used frequently by 74% of HR professionals. This is followed by behavioral interviews (73%), phone screening (57%), and panel interviews (48%).(LinkedIn Glocal Recruiting Trends 2018)
Millennials make up 38% of the American workforce, on track for up to 75% by 2025. (Gallup 2016)
Millennials have the highest rates of unemployment and underemployment. (Gallup State of the American Workplace Report 2017)
71% of Millennials say they're not engaged or are actively disengaged at work. (Gallup 2016)
Estimates show that Millennial turnover due to poor engagement costs the US economy $30.5 billion a year. (Gallup 2016)
Millennials change jobs an average of four times in their first decade out of college.
(LinkedIn 2016)
What methods and tools engage and retain Millennials?
According to Recruiters:
○ Ability to Work from Home - 38%
○ Career Pathing - 32%
○ Cool Technology - 23%
○ Not Applicable - 18%
○ Company Perks - 17%
○ Open Floor Plans - 14%
○ Mobile over Desktop - 13%
○ Internal Social Sharing Platforms - 10%
○ Groups Devoted to Mentoring and Diversity - 9%
○ Other - 3%
(2017 Millennial Hiring Trends Study MRI Network)
60% of Millennials (US) say they’re open to different job opportunities. (Gallup 2016)
Yet, American Millennials are now more likely to say they will stay 5+ years with a company than to leave within 2 years. (2017 Deloitte Millennial Survey)
In 2016, 64% of US Millennials planned on leaving their jobs in the next 5 years. (2016 Deloitte Millennial Survey)
What will Millennials change their job for?:
○ Paid Vacation - 64%
○ Flextime - 63%
○ Other Insurance Coverage - 60%
○ Flexible Location (Off-site Part Time) - 50%
○ Flexible Location (Off-site Full Time) - 47%
○ Student Loan Reimbursement - 45%
○ Tuition Reimbursement - 45%
○ Paid Maternity Leave - 44%
○ Paid to Work on Independent Project - 42%
○ Professional Development Programs - 41%
○ Paid Paternity Leave - 37%
○ Child Care Reimbursement - 30%
(Gallup State of the American Workplace Report 2017)
38% of Millennials worldwide plan on leaving their jobs within 2 years, down from 44% in 2016. (2017 Deloitte Millennial Survey)
31% of Millennials worldwide plan on staying 5+ years in their job, up from 27% in 2016. (2017 Deloitte Millennial Survey)
7% of Millennials worldwide say they will "leave soon," down from 17% in 2016. (2017 Deloitte Millennial Survey)
What are the top channels used to attract Millennials?
According to Millennials:
○ Market Reputation (Employer Brand) - 40%
○ Goodwill/Community Outreach - 16%
○ Employee Ambassadors - 15%
○ Online Presence - 12%
○ Quick Mobile-apply Process - 11%
○ Other - 6%
(2017 Millennial Hiring Trends Study MRI Network)
What is most important to Millennials?
According to Millennials:
○ Compensation and Benefits - 28%
○ Mentorship - 26%
○ Opportunities for Advancement - 26%
○ Sense of Purpose from Work - 16%
○ Work-life Balance - 16%
○ Flexible Arrangements (Remote Work) - 5%
○ Fun Company Culture - 3%
○ Teams - 2%
○ Other - 2%
○ Company Perks - 1%
○ Cutting-edge Technology - 1%
(2017 Millennial Hiring Trends Study MRI Network)
50% of Millennials say they’d consider taking a job with a different company for a raise of 20% or less. (Gallup 2016)
87% rate professional career growth and developmental opportunities as important to them in a job. (Gallup 2016)
Nearly 80% of Millennials look for people and culture fit with employers, followed by career potential. (Collegefeed, March 2014)
45% of Millennials rate professional career growth as "very important" to them as opposed to 31% of GenXers and 18% of Baby Boomers. (Gallup State of the American Workplace Report 2017)
65% of Millennials prefer full time employment as it offers them "job security" and a "fixed income." (2017 Deloitte Millennial Survey)
Two thirds of Millennials have employers with flexible arrangements - 69% with flexible working hours and 68% with flexible roles. (2017 Deloitte Millennial Survey)
61% of Millennials believe GenZ will have a positive impact on the workplace. (2017 Deloitte Millennial Survey)
In 2015, Millennials became the dominant demographic on the labor market. (Pew Research 2015)
What will Millennials change jobs for?:
○ Paid Vacation - 64%
○ Flextime - 63%
○ Other Insurance Coverage - 60%
○ Flexible Location (Off-site Part Time) - 50%
○ Flexible Location (Off-site Full Time) - 47%
○ Student Loan Reimbursement - 45%
○ Tuition Reimbursement - 45%
○ Paid Maternity Leave - 44%
○ Paid to Work on Independent Project - 42%
○ Professional Development Programs - 41%
○ Paid Paternity Leave - 37%
○ Child Care Reimbursement - 30%
(State of the American Workplace Gallup 2017)
Millennials have the highest rates of unemployment and underemployment. (State of the American Workplace Report Gallup 2017)
Body odor turns off 56% of recruiters, while dressing “too casually” impacts hiring decisions for 62% of them. (Jobvite Recruiter Nation Report 2016)
(Gallup State of the American Workplace Report 2017)
Job seekers say they use an average of 7.6 job sites during a job search. (Glassdoor 2016)
79% of job seekers say they are likely to use social media in their job search (Glassdoor 2013)
18% of job seekers said they will check out hiring managers on social media platforms while job hunting. (Careerbuilder 2016)
After finding a job offer, 64% of candidate said they research a company online and 37% said they will move on to another job offer if they can’t find information on the company. (Careerbuilder 2016)
50.5% of recruiters say social media has changed their recruiting results. (2016 Recruiting Benchmark Survey NACE)
29% of recruiters are investing in recruiting via social media platforms. (Jobvite Recruiter Nation Report 2016)
60% of recruiters are investing in company career websites. (Jobvite Recruiter Nation Report 2016)
28% of recruiters are investing in recruiting via job boards. (Jobvite Recruiter Nation Report 2016)
The top social media platforms recruiters use to check candidates include:
○ LinkedIn - 87%
○ Facebook - 43%
○ Twitter - 22%
○ Blog - 11%
○ Instagram - 8%
○ Youtube - 6%
○ Snapchat - 3%
(Jobvite Recruiter Nation Report 2016)
87% of recruiters use LinkedIn to check candidates, but only 43% use Facebook and 22% Twitter (Jobvite Recruiter Nation Report 2016)
67% of social job seekers use Facebook to search for jobs. (Jobvite Recruiter Nation Report 2016)
60% of recruiters use social networking sites to research candidates. (Careerbuilder)
59% of recruiters use search engines to look up candidates. (Careerbuilder)
Recruiters will disqualify candidates if they find evidence of the following on their social media profiles:
Recruiters will disqualify candidates if they find evidence of the following on their social media profiles:
○ Typos - 72%
○ Marijuana - 71%
○ Oversharing - 60%
○ Alcohol - 47%
○ Selfies - 18%
(Jobvite Recruiter Nation Report 2016)
For recruiters over 65, 63% find evidence of alcohol consumption on social media as negative. (Jobvite Recruiter Nation Report 2016)
41% of employers say that they might not interview a candidate if they can’t find them online. (Careerbuilder)
Only 36% of recruiters will try to add candidates as friends on a private account. When asked, 68% of job seekers granted permission, which is down from 80%. (Careerbuilder)
41% of employers say they research current employees on social media, with 32% using search engines. (Careerbuilder)
63% of US employers expect employees to have social media experience. (Careerbuilder 2017)
8
Employer Branding Statistics
51% of recruiters say that employee branding is the number one investment that they will increase in the next year. (Jobvite Recruiter Nation Report 2016)
Employer branding has a significant impact on hiring talent according to 80% of recruiters. (LinkedIn Global Recruiting Trends 2017)
46% of Glassdoor members read reviews before they speak with a company recruiter or hiring manager. (Glassdoor Survey September 2013)
86% of Glassdoor users read company reviews and ratings before making a decision to apply for a job. (Glassdoor US Site Survey January 2020)
55% of jobseekers who have read a negative review have decided not to apply for a job at that company.(CareerArc)
36% of employees say a company's market reputation is "very important" when considering a new job. (Gallup State of the American Workplace Report 2017)
39% of women vs. 33% of men say market reputation is "very important" when considering a new job. (Gallup)
40% of Millennials say market reputation has the biggest influence on their impression of an employer. (2017 Millennial Hiring Trends Study MRI Network)
69% of job seekers are likely to apply to a job if the employer actively manages its brand (e.g., responds to reviews, updates profiles, shares info on culture and work environment). (Glassdoor 2016)
62% of Glassdoor users agree that their perception of a company improves after seeing an employer respond to a review. (Glassdoor US Site Survey January 2016)
Companies with positive brands get 2x as many applications as companies with negative brands, and they spend less on employees. (Betterteam Blog 2017)
Companies with bad reputations pay 10% more per hire. (Harvard Business Review 2016)
50% of candidates say they wouldn't work for a company with a bad reputation - even for a pay increase. (Betterteam Blog 2017)
Only 8% of the recruiting budget is spent on employer branding. (LinkedIn Global Recruiting Trends 2017)
Given an unlimited budget, 53% of recruiters would invest in employer branding. (LinkedIn Global Recruiting Trends 2017)
Organizations that do invest in employer branding are 3x more likely to make a quality hire. (Brandon Hall 2015)
The majority of job seekers read at least 6 reviews before forming an opinion of a company. (Glassdoor US Site Survey January 2016)
Fewer than half (49%) of employees would recommend their employer to a friend. (Glassdoor Data Labs, December 2015)
Best channels to build an employer brand:
○ My Company's Career Site - 61%
○ LinkedIn - 55%
○ Third-party Website or Job Board - 40%
○ Facebook - 35%
○ Campus Recruiting - 31%
(LinkedIn Global Recruiting Trends 2017)
Nearly 3 out of 4 employees say their employer does not (or doesn't know how) to use social media to promote their brand. (Glassdoor 2013)
9
Diversity Statistics
Employed workforce demographics by race:
○ African American - 11.9%
○ Asian - 6.1%
○ Hispanic or Latino - 16.7%
(US Bureau of Labor Statistics 2016)
Women make up 47% of the overall workforce. (Pew Research October 2016)
Women make up 55% of workers holding jobs requiring social skills. (Pew Research October 2016)
Women make up 52% of workers holding jobs requiring analytical skills. (Pew Research October 2016)
Men make up 70% of workers holding jobs requiring physical or manual skills. (Pew Research October 2016)
67% of active and passive job seekers say diversity is important to them when they’re evaluating companies and job offers. (Glassdoor Survey 2014)
80% of job seekers believe their companies foster diversity at work. (Jobvite 2017 Job Seeker Nation Study)
Here's who thinks diversity is "very important" in the workplace:
○ African Americans - 60%
○ Hispanics - 43%
○ Women - 36%
○ Asian/Pacific Islanders - 32%
○ Men - 29%
○ Whites - 27%
(Jobvite 2017 Job Seeker Nation Study)
32% of job seekers ranked diversity as "important," and 18% as "not important." (Jobvite 2017 Job Seeker Nation Study)
37% of recruiters ranked recruiting more diverse candidates as a top trend in the near future. (LinkedIn Global Recruiting Trends 2017)
In 2015, American women working full time were paid 80% of what their male counterparts made on average, creating a pay gap of 20%. (AAUW 2017)
Women are 82% more likely to believe that men are paid more for the same work. (Jobvite 2017 Job Seeker Nation Study)
Ethnically diverse companies are 35% more likely to have a financial performance above the industry mean. (McKinsey 2015)
Gender diverse companies are 15% more likely to have a financial performance above the industry mean. (McKinsey 2015)
Companies with the highest level of ethnical diversity will bring in 15 times more sales revenue than companies with the lowest level of racial diversity. (McKinsey 2015)
Women account for 19% of corporate board members in the US. (McKinsey 2017)
There are 32 female CEOs (1 Latina) of Fortune 500 companies up from 21 in 2016, but only accounting for 6.4% of the list. (2017 Fortune 500)
There are only 4 African American CEOs (all men) of Fortune 500 companies, accounting for 2% of the list. (2017 Fortune 500)
Conducting a phone Interview can add 6.8 - 8.2 days to the recruitment process. (Glassdoor)
In 2014, 48% of job seekers thought mobile devices would be the most common way to search for jobs by 2017. (Glassdoor 2014)
41% of US employers plan to use text messages to schedule job interviews. (Careerbuilder 2017)
Only 10% of recruiters were investing in providing applications via mobile in 2016. (Jobvite Recruiter Nation Report 2016)
In 2014, 45% of job seekers said they used their mobile devices to search for jobs at least once a day. (Glassdoor 2014)
By 2016, only 19% of recruiters were investing in a mobile career website. (Jobvite Recruiter Nation Report 2016)
Mobile job seekers reported searching for jobs in bed (52%), at their current job (37%), or in the restroom (15%) (Jobvite Recruiter Nation Report 2016)
In 2014, 89% of job seekers believed a mobile device was an important tool for the job search. (Glassdoor 2014)
11
Students and Recent Graduates Statistics
It takes the average college graduate three to six months to secure employment after graduation.(University of Washington 2019)
In 2016, 44% of new grads wanted to work for medium or small businesses and startups. (Accenture 2016)
In 2017, 19% of grads want to work for large companies, up 37% over 2016 grads. (Gen Z Report Accenture 2017)
69% of 2017 grads expect to make more than $35,000 a year, only 49% of recent grads make that much. (Gen Z Report Accenture 2017)
66% of 2017 grads believe they can make more than $35,000 a year at large companies vs. 44% at small companies. (Gen Z Report Accenture 2017)
81% of 2017 grads believe they can advance their careers in large companies, vs. 63% in small companies. (Gen Z Report Accenture 2017)
78% of 2017 grads completed an internship or apprenticeship. (Gen Z Report Accenture 2017)
72% of 2017 grads believe they can get training at large companies vs. 57% at small companies. (Gen Z Report Accenture 2017)
29% of 2017 grads believe they will stay 5+ years at a large company vs. 9% at small companies. (Gen Z Report Accenture 2017)
Recruiters are hiring recent graduates for:
○ IT Positions - 27%
○ Customer Service - 26%
○ Finance - 19%
○ Business Development - 19%
○ Sales - 17%
(Careerbuilder)
Recruiters are looking for candidates with the following majors:
○ Business - 35%
○ Computer and Information Sciences - 23%
○ Engineering - 18%
○ Math and Statistics - 15%
○ Health Professionals and Related Clinical Sciences - 14%
○ Communications Technologies - 11%
○ Engineering Technologies - 11%
○ Communication and Journalism - 8%
○ Liberal Arts and Sciences, General Studies, and Humanities - 7%
○ Science Technologies - 7%
○ Social Sciences - 6%
○ Biological and Biomedical Sciences - 6%
○ Architecture and Planning - 6%
○ Education - 5%
(Careerbuilder)
94% of 2017 grads expect to find a job in their field of study. (Gen Z Report Accenture 2017)
Only 57% of recent grads work full-time in their field of study. (Gen Z Report Accenture 2017)
In 2016, 68% of new grads said they wanted on-the-job learning and 67% got training from their first employer. (Gen Z Report Accenture 2017)
97% of 2017 grads said they will need on-the-job training to further their careers. (Gen Z Report Accenture 2017)
Only 27% of college graduates are working in a job directly related to their major. (Undergraduate degree holders) (Federal Reserve Bank of New York)
Only 24% of employers feel that new graduates are not prepared for work at all. (Careerbuilder)
Recruiters blame missing skills on
○ Book Learning Over Real-world Learning - 47%
○ No Blend of Technical and Liberal Arts Skills - 39%
○ Not Prepared for the Complexity of Entry-level Roles - 25%
○ No Focus on Internships - 13%
○ Are Up-to-date with Technology Changes - 13%
○ Wrong Degree - 11%
(Careerbuilder)
83% of 2017 grads believe their education prepared them for their career, but 84% still expect formal training. (Gen Z Report Accenture 2017)
54% of recent grads consider themselves underemployed, up from 51% in 2016 and 41% in 2013. (Gen Z Report Accenture 2017)
Recent grads are 2.5x more likely to stay for 5+ years if they don't feel underemployed and their skills are being used. (Gen Z Report Accenture 2017)
2017 grads are flexible about:
○ Relocating for the Job - 75% (up from 72% in 2016)
○ Weekends and Evening - 58% (up from 52% in 2016)
○ Unpaid Internship in Place of Paid Opening - 71%
(Gen Z Report Accenture 2017)
In 2016, 92% of new graduates said that it’s important that their company is socially responsible. (Accenture 2016)
Key Takeaway
Facts, figures, and HR statistics can put your job search into perspective. It’s good to know how fierce the competition is and what you’re up against whether you're a recruiter or a job seeker. As a job seeker, it suddenly makes a lot of sense to put the effort and time into your resume when you know that hundreds of others also applied.
As for recruiters, knowing the numbers behind the job search can result in huge savings.
Either way, having a tangible sense of what it looks like to get a job in today’s market will give you the upper hand. And HR statistics are here to help.
Let us know in the comments if there are any other job statistics you’d like to see.
Editor-in-chief at Zety since 2016. His career advice and commentary has been published by the Financial Times, Hewlett-Packard, CareerBuilder, and Glassdoor, among others. With a strong passion for statistics and a background in psychology, Bart makes sure all the advice published on Zety is data-driven.
Looking for a Google Docs resume template that’s just right for you? See our selection of free and paid templates that are available in Google Drive and take your pick.
Some say the gig economy is booming, some say it’s declining. Learn the complex truth about the gig economy from statistics and research from 2023 aggregated from multiple independent sources.


![200+ Sales Statistics [Cold Calling, Follow-up, Closing Rates]](https://cdn-images.zety.com/pages/sales_statistics.jpg?fit=crop&h=250&dpr=2)
![Gig Economy: Definition, Statistics & Trends [2023 Update]](https://cdn-images.zety.com/pages/gig_economy_statistics_2.jpg?fit=crop&h=250&dpr=2)